


![[Webinar] AI Is Already Inside Your SaaS Stack — Learn How to Prevent the Next Silent Breach](https://blogger.googleusercontent.com/img/b/R29vZ2xl/AVvXsEiOWn65wd33dg2uO99NrtKbpYLfcepwOLidQDMls0HXKlA91k6HURluRA4WXgJRAZldEe1VReMQZyyYt1PgnoAn5JPpILsWlXIzmrBSs_TBoyPwO7hZrWouBg2-O3mdeoeSGY-l9_bsZB7vbpKjTSvG93zNytjxgTaMPqo9iq9Z5pGa05CJOs9uXpwHFT4/s1600/ai-cyber.jpg?#)


![[The AI Show Episode 144]: ChatGPT’s New Memory, Shopify CEO’s Leaked “AI First” Memo, Google Cloud Next Releases, o3 and o4-mini Coming Soon & Llama 4’s Rocky Launch](https://www.marketingaiinstitute.com/hubfs/ep%20144%20cover.png)


![Rogue Company Elite tier list of best characters [April 2025]](https://media.pocketgamer.com/artwork/na-33136-1657102075/rogue-company-ios-android-tier-cover.jpg?#)


_Andreas_Prott_Alamy.jpg?width=1280&auto=webp&quality=80&disable=upscale#)


![What’s new in Android’s April 2025 Google System Updates [U: 4/18]](https://i0.wp.com/9to5google.com/wp-content/uploads/sites/4/2025/01/google-play-services-3.jpg?resize=1200%2C628&quality=82&strip=all&ssl=1)


![Apple Watch Series 10 Back On Sale for $299! [Lowest Price Ever]](https://www.iclarified.com/images/news/96657/96657/96657-640.jpg)
![EU Postpones Apple App Store Fines Amid Tariff Negotiations [Report]](https://www.iclarified.com/images/news/97068/97068/97068-640.jpg)
![Apple Slips to Fifth in China's Smartphone Market with 9% Decline [Report]](https://www.iclarified.com/images/news/97065/97065/97065-640.jpg)


10 Top SaaS Monitoring Solutions
As the SaaS market surges toward a projected $299 billion valuation by the end of 2025, businesses are becoming increasingly dependent on cloud-based applications. With this growing reliance comes a greater need for robust monitoring capabilities that ensure availability, performance, and security. That’s where the right SaaS monitoring tool makes all the difference. These tools are used to monitor the health and performance of SaaS applications, helping IT teams detect downtime, troubleshoot issues, and deliver seamless user experiences. In this guide, we’ll break down some of the top 10 SaaS tools used to monitor modern cloud environments. We’ll explore APM tools, their essential features, and what to look for when choosing a tool to monitor your SaaS stack effectively. What Are SaaS Monitoring Tools? SaaS monitoring tools are used to monitor the performance, uptime, security, and reliability of cloud-based applications. They provide real-time insights into key metrics such as API performance, response times, latency, and error rates, ensuring optimal performance for SaaS applications and infrastructure. Key Monitoring Capabilities to Look For Real-Time Performance Tracking – Keep tabs on response times, server load, and user activity across your apps. Downtime Alerts – Receive instant alerts when a cloud service goes down, so your team can act fast. Status Pages – Share internal or public-facing service status updates. Tools like StatusGator even aggregate the status pages of multiple SaaS providers into one unified view. User Experience Monitoring – Gain insights into how real users interact with your application to improve frontend performance. Security and Compliance Checks – Monitor applications for vulnerabilities and ensure compliance with industry regulations. Cost Management – Track SaaS spend and usage to optimize budgets and eliminate waste. Whether you're overseeing a growing SaaS environment or just starting to scale, the right monitoring tool is essential to maintaining performance and trust. Let’s dive into the best SaaS solutions available today. 1. StatusGator Best for: Monitoring third-party SaaS services and cloud infrastructure dependencies StatusGator offers a different take on SaaS monitoring. This solution aggregates status data from over 5,000 cloud services, giving you a unified view of your entire external stack. With public or private status pages, real-time alerts, and Early Warning Signals (which can detect outages before official status updates), StatusGator is ideal for SaaS teams that want to stay ahead of support tickets and customer complaints. Features Real-time uptime monitoring across 5,000+ SaaS services and websites. Aggregated status page monitoring from thousands of providers. Early warning signals detect anomalies before official status updates ensuring proactive monitoring of SaaS availability. Custom, branded status pages to communicate incidents and maintenance. Private status pages for internal IT team visibility. Instant alerts via Slack, Microsoft Teams, email, webhook, and more. Private status ingestion for API-level monitoring of private services (Enterprise). StatusGator empowers SaaS teams to monitor third-party dependencies alongside their own infrastructure, detect outages early, and proactively communicate with customers. With public and private status pages, it streamlines incident transparency and internal operation, reducing support tickets and improving response times. 2. New Relic Best for: DevOps and SRE teams needing unified monitoring New Relic offers full-stack observability with deep support for APM, logs, infrastructure, and even RUM (Real User Monitoring). It’s known for powerful dashboards, anomaly detection, and being CI/CD-friendly. Features Full-stack APM to monitor application health, transactions, and dependencies in real time to quickly identify performance issues. AI-driven insights to detect anomalies, predict issues, and trigger automated alerts for faster resolution. Infrastructure and deployment monitoring for visibility into cloud-native, hybrid, and on-prem infrastructure, and assess how deployments affect performance. Collaboration tools for DevOps and SRE to share dashboards and reports across teams, and integrate with CI/CD pipelines for real-time deployment monitoring. Extensive integrations allow you to connect with AWS, Kubernetes, and CI/CD tools to unify logs, metrics, and traces across your tech stack. 3. Sentry Best for: Real-time error tracking and debugging Sentry is built for developers who want to catch and fix application bugs quickly. With code-level visibility and performance monitoring, it’s perfect for SaaS teams prioritizing quality and stability. Features Real-time error tracking automatically detects crashes, exceptions, and performance issues with precise code-level insights for faster d
As the SaaS market surges toward a projected $299 billion valuation by the end of 2025, businesses are becoming increasingly dependent on cloud-based applications.
With this growing reliance comes a greater need for robust monitoring capabilities that ensure availability, performance, and security. That’s where the right SaaS monitoring tool makes all the difference.
These tools are used to monitor the health and performance of SaaS applications, helping IT teams detect downtime, troubleshoot issues, and deliver seamless user experiences.
In this guide, we’ll break down some of the top 10 SaaS tools used to monitor modern cloud environments. We’ll explore APM tools, their essential features, and what to look for when choosing a tool to monitor your SaaS stack effectively.
What Are SaaS Monitoring Tools?
SaaS monitoring tools are used to monitor the performance, uptime, security, and reliability of cloud-based applications. They provide real-time insights into key metrics such as API performance, response times, latency, and error rates, ensuring optimal performance for SaaS applications and infrastructure.
Key Monitoring Capabilities to Look For
Real-Time Performance Tracking – Keep tabs on response times, server load, and user activity across your apps.
Downtime Alerts – Receive instant alerts when a cloud service goes down, so your team can act fast.
Status Pages – Share internal or public-facing service status updates. Tools like StatusGator even aggregate the status pages of multiple SaaS providers into one unified view.
User Experience Monitoring – Gain insights into how real users interact with your application to improve frontend performance.
Security and Compliance Checks – Monitor applications for vulnerabilities and ensure compliance with industry regulations.
Cost Management – Track SaaS spend and usage to optimize budgets and eliminate waste.
Whether you're overseeing a growing SaaS environment or just starting to scale, the right monitoring tool is essential to maintaining performance and trust. Let’s dive into the best SaaS solutions available today.
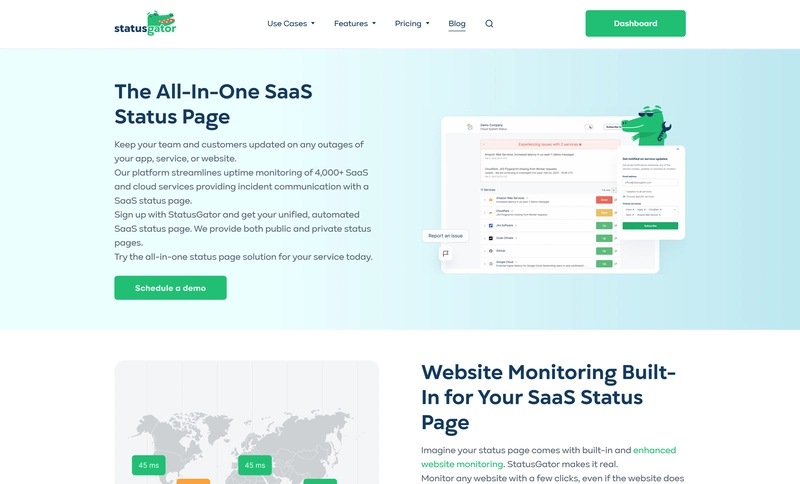
1. StatusGator
Best for: Monitoring third-party SaaS services and cloud infrastructure dependencies
StatusGator offers a different take on SaaS monitoring. This solution aggregates status data from over 5,000 cloud services, giving you a unified view of your entire external stack.
With public or private status pages, real-time alerts, and Early Warning Signals (which can detect outages before official status updates), StatusGator is ideal for SaaS teams that want to stay ahead of support tickets and customer complaints.
Features
Real-time uptime monitoring across 5,000+ SaaS services and websites.
Aggregated status page monitoring from thousands of providers.
Early warning signals detect anomalies before official status updates ensuring proactive monitoring of SaaS availability.
Custom, branded status pages to communicate incidents and maintenance.
Private status pages for internal IT team visibility.
Instant alerts via Slack, Microsoft Teams, email, webhook, and more.
Private status ingestion for API-level monitoring of private services (Enterprise).
StatusGator empowers SaaS teams to monitor third-party dependencies alongside their own infrastructure, detect outages early, and proactively communicate with customers.
With public and private status pages, it streamlines incident transparency and internal operation, reducing support tickets and improving response times.
2. New Relic
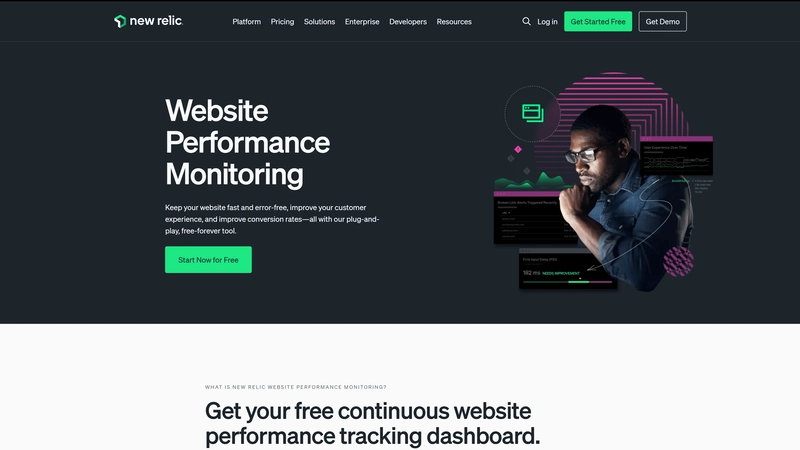
Best for: DevOps and SRE teams needing unified monitoring
New Relic offers full-stack observability with deep support for APM, logs, infrastructure, and even RUM (Real User Monitoring). It’s known for powerful dashboards, anomaly detection, and being CI/CD-friendly.
Features
Full-stack APM to monitor application health, transactions, and dependencies in real time to quickly identify performance issues.
AI-driven insights to detect anomalies, predict issues, and trigger automated alerts for faster resolution.
Infrastructure and deployment monitoring for visibility into cloud-native, hybrid, and on-prem infrastructure, and assess how deployments affect performance.
Collaboration tools for DevOps and SRE to share dashboards and reports across teams, and integrate with CI/CD pipelines for real-time deployment monitoring.
Extensive integrations allow you to connect with AWS, Kubernetes, and CI/CD tools to unify logs, metrics, and traces across your tech stack.
3. Sentry
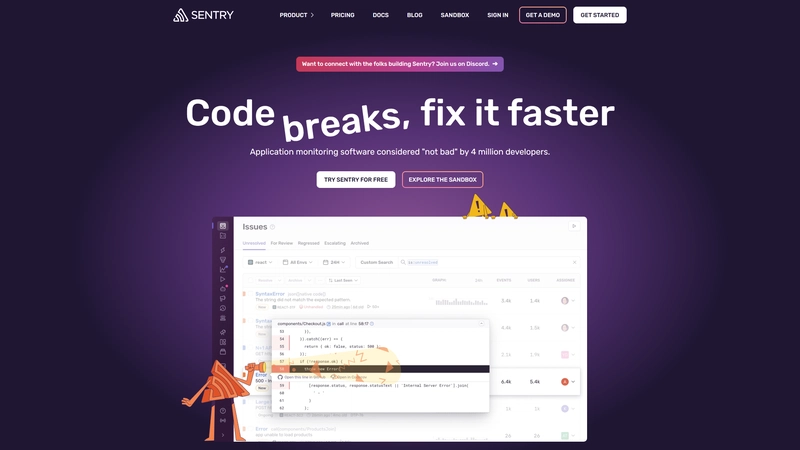
Best for: Real-time error tracking and debugging
Sentry is built for developers who want to catch and fix application bugs quickly. With code-level visibility and performance monitoring, it’s perfect for SaaS teams prioritizing quality and stability.
Features
Real-time error tracking automatically detects crashes, exceptions, and performance issues with precise code-level insights for faster debugging.
Custom dashboards and queries to monitor application health across projects and services.
Distributed tracing of slow API calls, transactions, and dependencies with detailed stack traces and breadcrumbs for full context.
Release and ownership insights allow linking issues to specific releases to pinpoint problematic deployments and assign issue owners for efficient resolution.
4. AppDynamics
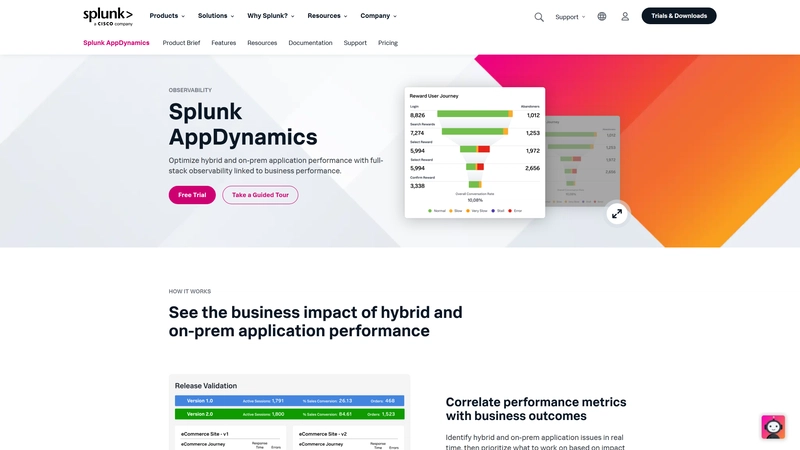
Best for: Business-critical app monitoring with deep insights
AppDynamics offers end-to-end tracing and real-time performance analytics tied to business outcomes. Owned by Cisco, it’s built for enterprises that need to see the big picture from backend code to user behavior.
Features
End-to-End transaction tracing and real-time analytics follow each business transaction across distributed systems to uncover bottlenecks, slow queries, and inefficient code paths.
AI-powered performance monitoring and anomaly detection leverages machine learning to detect anomalies proactively, with dynamic baselining that adapts to changing application behavior.
Infrastructure and cloud monitoring that delivers deep visibility into on-premises, cloud, and hybrid environments and tracks servers, containers, databases, and microservices.
Integrations with AWS, Azure, Kubernetes, and leading databases, while integrating smoothly into DevOps workflows and CI/CD pipelines.
5. Nagios
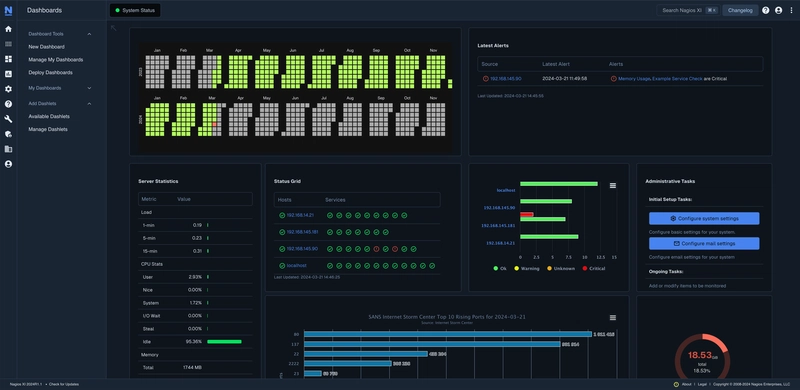
Best for: Customizable IT infrastructure monitoring
Nagios is open-source, flexible, and powerful. With a huge plugin ecosystem, it's ideal for tech-savvy teams that want total control over what they monitor and how.
Features
IT network monitoring includes servers, network devices, applications, and cloud services, as well as metrics like CPU, memory, disk usage, and performance trends.
Real-time alerts to catch issues early, with notifications delivered via email, SMS, and integrations with third-party tools.
Advanced reporting with diagnostics and capacity planning, with intuitive dashboards for real-time infrastructure insights.
Extensive plugin library with over 5,000 plugins to monitor virtually any IT component, backed by a vibrant community that ensures constant updates and new integrations.
6. LogicMonitor
Best for: Hybrid IT and cloud infrastructure monitoring
LogicMonitor auto-discovers resources and sets up monitoring for servers, apps, databases, and networks, on-prem or cloud. With AI-powered anomaly detection and clean dashboards, it's a solid enterprise-grade platform.
Features
Automated discovery and intelligent monitoring to identify devices, applications, and cloud resources across hybrid environments, using dynamic thresholds to detect anomalies early.
End-to-end infrastructure visibility into servers, networks, databases, applications, and cloud platforms (including AWS, Azure, GCP, VMware, Cisco) through a unified real-time dashboard.
Proactive alerting and AI-powered insights that leverage predictive analytics to anticipate failures and reduce downtime, with customizable alerts that cut through the noise for faster response.
Workflow-friendly integrations with ServiceNow, Slack, Teams, JIRA, and popular DevOps tools to enable seamless collaboration and incident management.
7. Atatus
Best for: APM with frontend + backend visibility
Atatus provides everything from error tracking and synthetic monitoring to real user experience metrics. It’s a great all-in-one APM choice for teams that want deep monitoring without the enterprise-level pricing.
Features
Real-time error tracking to instantly identify crashes, exceptions, and performance issues, delivering alerts via Slack, Jira, Webhooks, and other channels.
Application performance monitoring to track response times, database queries, and system bottlenecks to highlight underperforming areas of your application.
User experience monitoring that analyzes page load times and real user interactions to uncover front-end performance issues and optimize browser-side performance.
Integrations with tools like Slack, Jira, and Webhooks to streamline workflows and ensure teams are notified the moment issues arise.
8. Site24x7
Best for: Full-stack synthetic and real user monitoring
Site24x7 monitors everything from websites to cloud apps and servers, with deep support for synthetic checks and cloud infrastructure observability across AWS, Azure, and GCP.
Features
Full-stack web and cloud monitoring to track application uptime, performance, and reliability across your entire tech stack, with AI-driven insights to spot issues before they escalate.
Synthetic monitoring that simulates user journeys to uncover performance bottlenecks, while capturing real user behavior to enhance the overall experience with insights.
Cloud and SaaS platform integrations provide seamless monitoring across major cloud providers like AWS, Azure, and Google Cloud for complete visibility into your infrastructure.
9. SolarWinds
Best for: Comprehensive monitoring capabilities with APM, uptime, and log monitoring for SaaS apps
SolarWinds combines monitoring software - AppOptics, Pingdom, and Loggly into a single, powerful observability platform. Designed for full-stack monitoring, it helps IT and DevOps teams ensure application reliability, performance, and user satisfaction across cloud-native, hybrid, and on-prem environments.
Features
Infrastructure and application monitoring on-premises, and hybrid environments—including AWS, Azure, virtual machines, and physical servers.
Tracking key system metrics like CPU, memory, and network usage, while leveraging distributed tracing and live code profiling to identify performance bottlenecks in Java, .NET, and more.
Real user and synthetic monitoring with Pingdom to simulate real user interactions and run automated checks from global locations to measure uptime and detect slow-loading pages.
Centralized log management that collects logs from SaaS apps, cloud services, databases, and mobile apps.
Searching massive log datasets in real time to accelerate troubleshooting and incident response. Correlate logs with metrics and traces from AppOptics and Pingdom for complete root cause analysis.
10. Datadog
Best for: Full-stack observability and analytics in cloud-native environments
Datadog provides unified monitoring data across distributed environments through a single, consolidated platform. It's is a go-to monitoring platform for developers and ops teams looking to monitor logs, metrics, traces, and user experience all in one place. It supports 600+ integrations and works well across hybrid or multi-cloud environments.
Features
Real-time monitoring that continuously collects logs, metrics, and traces from cloud, on-premises, and hybrid environments.
AI-powered analytics and AI-driven anomaly detection that identify issues early to prevent downtime and performance degradation.
Infrastructure visualization to easily build real-time dashboards with a drag-and-drop interface. Visualize cloud infrastructure across services for complete operational visibility.
Extensive integrations including AWS, Azure, Google Cloud, Kubernetes, Docker, Slack, and various SaaS tools.
Application monitoring of web and mobile applications to ensure speed and reliability.
Real user monitoring (RUM) to capture actual user behavior and optimize the customer experience.
Summary
As businesses scale and cloud adoption continues to rise, having a powerful monitoring system is no longer optional, it's essential.
The tools covered in this guide offer a wide range of capabilities to help IT and DevOps teams maintain optimal performance, resolve network issues quickly, and ensure a seamless user experience across SaaS environments.
Whether you're monitoring internal applications or third-party dependencies, the right SaaS monitoring tool will give you full visibility into key performance metrics like uptime, latency, error rates, and resource usage.
These insights empower teams to track performance metrics in real time, proactively manage incidents, and improve application reliability.
By choosing the best solution tailored to your tech stack and business needs, you can stay ahead of outages, optimize system health, and deliver consistent, high-quality experiences to your users.