


![[The AI Show Episode 144]: ChatGPT’s New Memory, Shopify CEO’s Leaked “AI First” Memo, Google Cloud Next Releases, o3 and o4-mini Coming Soon & Llama 4’s Rocky Launch](https://www.marketingaiinstitute.com/hubfs/ep%20144%20cover.png)


![Is this too much for a modular monolith system? [closed]](https://i.sstatic.net/pYL1nsfg.png)


_Andreas_Prott_Alamy.jpg?width=1280&auto=webp&quality=80&disable=upscale#)


![What features do you get with Gemini Advanced? [April 2025]](https://i0.wp.com/9to5google.com/wp-content/uploads/sites/4/2024/02/gemini-advanced-cover.jpg?resize=1200%2C628&quality=82&strip=all&ssl=1)


![Apple Shares Official Trailer for 'Long Way Home' Starring Ewan McGregor and Charley Boorman [Video]](https://www.iclarified.com/images/news/97069/97069/97069-640.jpg)
![Apple Watch Series 10 Back On Sale for $299! [Lowest Price Ever]](https://www.iclarified.com/images/news/96657/96657/96657-640.jpg)
![EU Postpones Apple App Store Fines Amid Tariff Negotiations [Report]](https://www.iclarified.com/images/news/97068/97068/97068-640.jpg)
![Apple Slips to Fifth in China's Smartphone Market with 9% Decline [Report]](https://www.iclarified.com/images/news/97065/97065/97065-640.jpg)


How Microsoft Excel Powers Data Science and Analytics: Benefits, Tools, and Real-World Use Cases.
Microsoft Excel has long been a cornerstone tool in the world of data science and data analytics, despite the rise of more advanced programming languages and platforms like Python, R, and specialized software such as Tableau or Power BI. Its accessibility, versatility, and robust functionality make it an indispensable asset for professionals and beginners alike. From small-scale data manipulation to complex analytical tasks, Excel remains a go-to solution for data scientists and analysts across industries. This article explores the critical role Excel plays in data science and data analytics, highlighting its strengths, applications, and enduring relevance in a rapidly evolving field. Accessibility and User-Friendliness One of Excel’s greatest strengths is its accessibility. With a familiar interface and widespread availability as part of the Microsoft Office suite, Excel is often the first tool that aspiring data professionals encounter. Unlike programming languages that require extensive learning curves, Excel allows users to dive into data manipulation with minimal setup. Its intuitive grid-based structure, combined with a point-and-click interface, lowers the barrier to entry for beginners in data science and analytics. For small businesses or individuals without access to expensive software, Excel provides a cost-effective solution for data analysis. Its presence on most workplace computers means that employees can immediately begin working with data without the need for specialized training or infrastructure. This democratization of data analysis has made Excel a staple in industries ranging from finance to marketing, where quick insights are often needed without the complexity of advanced tools. Data Organization and Cleaning Data science and analytics workflows often begin with data preparation, a phase that can consume up to 80% of a professional’s time. Excel excels in this area, offering a suite of tools for organizing, cleaning, and transforming raw data. Features like sorting, filtering, and removing duplicates allow users to quickly structure datasets for analysis. Text functions such as TRIM, CONCATENATE, and LEFT/RIGHT enable precise manipulation of string data, while conditional formatting highlights anomalies or trends for further investigation. Data Visualization Effective data communication is a cornerstone of data science and analytics, and Excel’s visualization capabilities play a significant role. Its charting tools allow users to create a wide range of visuals, from pie charts, bar and line graphs to scatter plots and histograms, with just a few clicks. Pivot Charts, paired with PivotTables, enable dynamic exploration of data, allowing analysts to uncover patterns and present findings in a visually appealing manner. While Excel’s visualizations may not match the sophistication of tools like Tableau, they are sufficient for many business applications. For example, a marketing analyst can use Excel to create a dashboard tracking campaign performance metrics, such as click-through rates and conversions, without needing advanced software. The ability to customize charts with colors, labels, and trendlines further enhances Excel’s utility in conveying insights to stakeholders. PivotTables for Dynamic Analysis PivotTables are among Excel’s most powerful features for data analytics. They allow users to summarize, group, and filter large datasets with a lot of ease, providing a dynamic way to explore data without altering the original dataset. For example, a sales analyst can use a PivotTable to aggregate revenue by region, product, or time period, identifying top-performing categories in seconds. The flexibility of PivotTables makes them ideal for ad-hoc analysis, where stakeholders require quick answers to specific questions. By combining PivotTables with slicers and timelines, analysts can create interactive reports that enable non-technical users to explore data independently. This functionality bridges the gap between raw data and actionable insights, reinforcing Excel’s importance in data-driven decision-making. Automation with VBA and Macros For repetitive tasks, Excel’s Visual Basic for Applications (VBA) and macro capabilities offer powerful automation. Data scientists and analysts can write scripts to streamline workflows, such as batch-processing multiple files or generating recurring reports. For example, a financial analyst might use VBA to automate the consolidation of monthly budget data from multiple departments, saving hours of manual work. While VBA requires some programming knowledge, its integration within Excel makes it more accessible than standalone scripting languages. Macros, which record user actions for playback, further simplify automation for non-coders. These features enhance Excel’s efficiency, allowing professionals to focus on analysis rather than repetitive tasks. Integration w
Microsoft Excel has long been a cornerstone tool in the world of data science and data analytics, despite the rise of more advanced programming languages and platforms like Python, R, and specialized software such as Tableau or Power BI. Its accessibility, versatility, and robust functionality make it an indispensable asset for professionals and beginners alike. From small-scale data manipulation to complex analytical tasks, Excel remains a go-to solution for data scientists and analysts across industries. This article explores the critical role Excel plays in data science and data analytics, highlighting its strengths, applications, and enduring relevance in a rapidly evolving field.
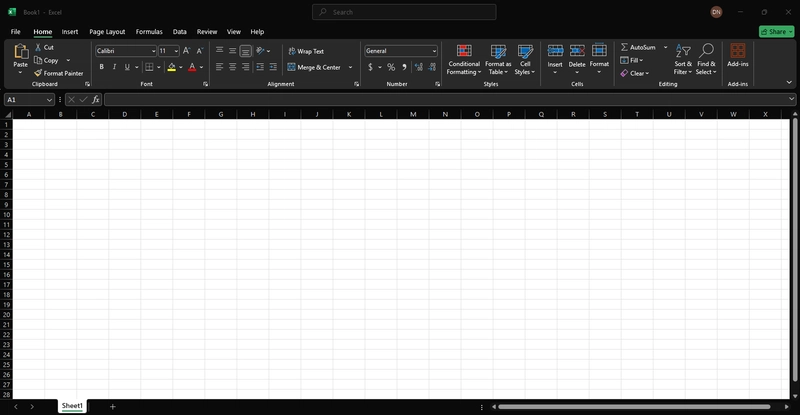
Accessibility and User-Friendliness
One of Excel’s greatest strengths is its accessibility. With a familiar interface and widespread availability as part of the Microsoft Office suite, Excel is often the first tool that aspiring data professionals encounter. Unlike programming languages that require extensive learning curves, Excel allows users to dive into data manipulation with minimal setup. Its intuitive grid-based structure, combined with a point-and-click interface, lowers the barrier to entry for beginners in data science and analytics.
For small businesses or individuals without access to expensive software, Excel provides a cost-effective solution for data analysis. Its presence on most workplace computers means that employees can immediately begin working with data without the need for specialized training or infrastructure. This democratization of data analysis has made Excel a staple in industries ranging from finance to marketing, where quick insights are often needed without the complexity of advanced tools.
Data Organization and Cleaning
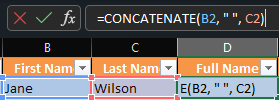
Data science and analytics workflows often begin with data preparation, a phase that can consume up to 80% of a professional’s time. Excel excels in this area, offering a suite of tools for organizing, cleaning, and transforming raw data. Features like sorting, filtering, and removing duplicates allow users to quickly structure datasets for analysis. Text functions such as TRIM, CONCATENATE, and LEFT/RIGHT enable precise manipulation of string data, while conditional formatting highlights anomalies or trends for further investigation.
![]()
Data Visualization
Effective data communication is a cornerstone of data science and analytics, and Excel’s visualization capabilities play a significant role. Its charting tools allow users to create a wide range of visuals, from pie charts, bar and line graphs to scatter plots and histograms, with just a few clicks. Pivot Charts, paired with PivotTables, enable dynamic exploration of data, allowing analysts to uncover patterns and present findings in a visually appealing manner.
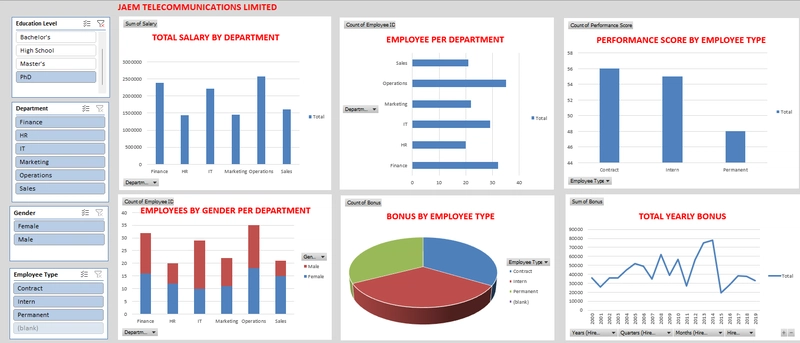
While Excel’s visualizations may not match the sophistication of tools like Tableau, they are sufficient for many business applications. For example, a marketing analyst can use Excel to create a dashboard tracking campaign performance metrics, such as click-through rates and conversions, without needing advanced software. The ability to customize charts with colors, labels, and trendlines further enhances Excel’s utility in conveying insights to stakeholders.
PivotTables for Dynamic Analysis
PivotTables are among Excel’s most powerful features for data analytics. They allow users to summarize, group, and filter large datasets with a lot of ease, providing a dynamic way to explore data without altering the original dataset. For example, a sales analyst can use a PivotTable to aggregate revenue by region, product, or time period, identifying top-performing categories in seconds.
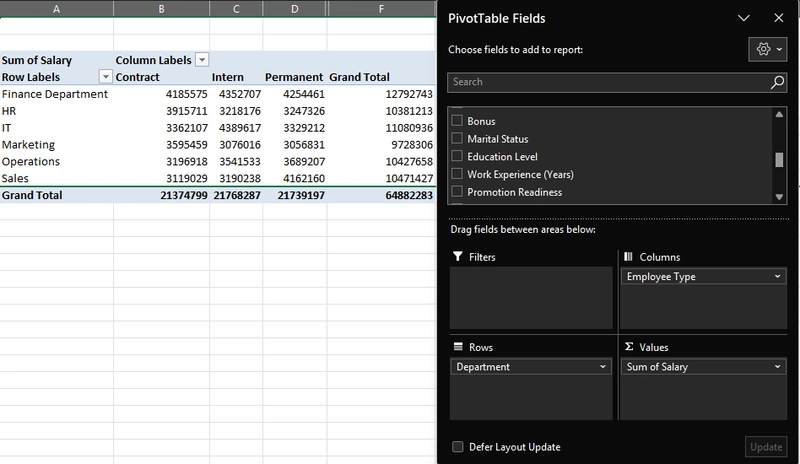
The flexibility of PivotTables makes them ideal for ad-hoc analysis, where stakeholders require quick answers to specific questions. By combining PivotTables with slicers and timelines, analysts can create interactive reports that enable non-technical users to explore data independently. This functionality bridges the gap between raw data and actionable insights, reinforcing Excel’s importance in data-driven decision-making.
Automation with VBA and Macros
For repetitive tasks, Excel’s Visual Basic for Applications (VBA) and macro capabilities offer powerful automation. Data scientists and analysts can write scripts to streamline workflows, such as batch-processing multiple files or generating recurring reports. For example, a financial analyst might use VBA to automate the consolidation of monthly budget data from multiple departments, saving hours of manual work.
While VBA requires some programming knowledge, its integration within Excel makes it more accessible than standalone scripting languages. Macros, which record user actions for playback, further simplify automation for non-coders. These features enhance Excel’s efficiency, allowing professionals to focus on analysis rather than repetitive tasks.
Integration with Other Tools
Excel’s compatibility with other data science and analytics tools ensures its relevance in modern workflows. It seamlessly integrates with databases through ODBC connections, allowing analysts to import data from SQL servers or cloud platforms. Excel also supports Power Query, a powerful ETL (Extract, Transform, Load) tool that automates data extraction and transformation from various sources, including APIs and web pages.
For advanced users, Excel serves as a complementary tool alongside Python or R. Data scientists often use Excel to prototype analyses or share results with stakeholders before scaling to more robust platforms. Its ability to export data in formats like CSV or JSON facilitates interoperability, ensuring Excel remains a key component of the data ecosystem.
Limitations and Complementary Role
Despite its strengths, Excel has limitations. It struggles with large datasets, typically slowing down with files exceeding a million rows, and lacks the computational power of specialized tools for complex machine learning or big data analytics. Additionally, its manual processes can introduce errors, particularly in collaborative environments where version control is critical.
However, these limitations do not diminish Excel’s value; rather, they highlight its role as a complementary tool. Data scientists often use Excel for initial exploration and cleaning before transitioning to Python for advanced modeling. Similarly, analysts rely on Excel for quick insights when time or resources are limited, reserving tools like Tableau for enterprise-level reporting.
Enduring Relevance
Excel’s enduring relevance in data science and analytics stems from its versatility, accessibility, and ability to evolve. Microsoft continues to enhance Excel with features like dynamic arrays, improved Power Query, and integration with cloud-based platforms like Microsoft 365. These updates ensure Excel remains competitive in a landscape increasingly dominated by specialized tools.
For students, small businesses, and professionals in non-technical roles, Excel is often the first step into data science and analytics. Its widespread use in industries like finance, retail, and healthcare underscores its practical value. Even as new tools emerge, Excel’s simplicity and familiarity guarantee its place in the data professional’s toolkit.
Conclusion
Microsoft Excel is far more than a spreadsheet application; it is a foundational tool in data science and data analytics. Its capabilities in data organization, visualization, statistical analysis, and automation make it indispensable for professionals at all levels. While it may not replace advanced platforms like Python or Tableau, Excel’s accessibility, versatility, and integration capabilities ensure its continued importance. As the field of data science evolves, Excel remains a trusted ally, empowering users to transform raw data into meaningful insights with ease and efficiency.