


![[The AI Show Episode 144]: ChatGPT’s New Memory, Shopify CEO’s Leaked “AI First” Memo, Google Cloud Next Releases, o3 and o4-mini Coming Soon & Llama 4’s Rocky Launch](https://www.marketingaiinstitute.com/hubfs/ep%20144%20cover.png)


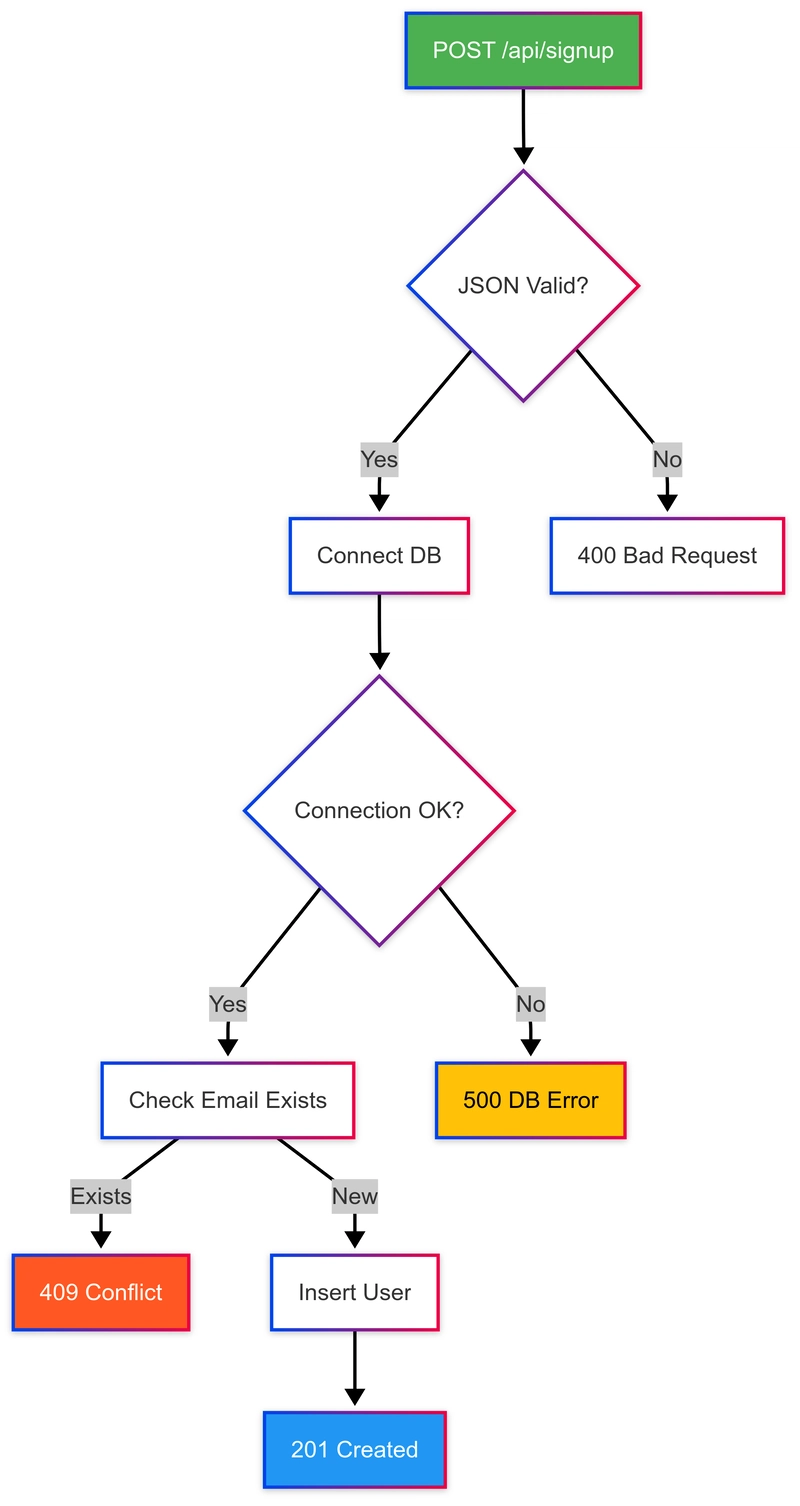
![Is this too much for a modular monolith system? [closed]](https://i.sstatic.net/pYL1nsfg.png)


_Andreas_Prott_Alamy.jpg?width=1280&auto=webp&quality=80&disable=upscale#)


![What features do you get with Gemini Advanced? [April 2025]](https://i0.wp.com/9to5google.com/wp-content/uploads/sites/4/2024/02/gemini-advanced-cover.jpg?resize=1200%2C628&quality=82&strip=all&ssl=1)


![Apple Shares Official Trailer for 'Long Way Home' Starring Ewan McGregor and Charley Boorman [Video]](https://www.iclarified.com/images/news/97069/97069/97069-640.jpg)
![Apple Watch Series 10 Back On Sale for $299! [Lowest Price Ever]](https://www.iclarified.com/images/news/96657/96657/96657-640.jpg)
![EU Postpones Apple App Store Fines Amid Tariff Negotiations [Report]](https://www.iclarified.com/images/news/97068/97068/97068-640.jpg)
![Apple Slips to Fifth in China's Smartphone Market with 9% Decline [Report]](https://www.iclarified.com/images/news/97065/97065/97065-640.jpg)


ใช้ LSTM vs Prophet เพื่อพยากรณ์อุณหภูมิเฉลี่ยรายวันจากข้อมูลจำลอง 730 วัน
ในปัจจุบันนั้นการนำ AI มาใช้ในการพยากรณ์สภาพอากาศหรืออุณหภูมิ นั้นสามารถพบเห็นได้โดยทั่วไป และมีการใช้โมเดลที่หลากหลาย ในส่วนของบทความนี้จะเป็นเปรียบเทียบการทำงานในการพยากรณ์อุณหภูมิระหว่างโมเดล LSTM(Long Short-Term Memory) และ Prophet โดยใช้เป็นข้อมูลจำลองและรันโค้ด Python ผ่าน Colab ของ Google เพื่อดูว่าทั้งสองโมเดลทำงานต่างกันยังไง โดยมีข้อมูล 2 ประเภทคือ วันที่ อุณหภูมิเฉลี่ยของวัน ขั้นตอนที่ 1: เตรียมข้อมูลที่จำเป็น โดยการสร้างข้อมูลอุณหภูมิเฉลี่ยของวัน ที่มีการบวกลบแบบสุ่มเล็กน้อยเพื่อความสมจริง จำนวนทั้งหมด 730 วัน import pandas as pd import numpy as np import matplotlib.pyplot as plt np.random.seed(42) days = pd.date_range(start="2025-01-01", periods=730) temperature = 20 + 10 * np.sin(2 * np.pi * days.dayofyear / 365) + np.random.normal(0, 1, len(days)) df = pd.DataFrame({'ds': days, 'y': temperature}) df.head() ตัวอย่างตารางข้อมูล โดย ds: วันที่ และ y: อุณหภูมิเฉลี่ยของวัน เขียนโค้ดเพื่อแบ่งข้อมูล: 80% สำหรับ Train โมเดลและ 20% สำหรับทดสอบโมเดล train_size = int(len(df) * 0.8) train_df = df[:train_size] test_df = df[train_size:] ขั้นตอนที่ 2: สร้างโมเดล Prophet เพื่อพยากรณ์อุณหภูมิ from prophet import Prophet prophet_model = Prophet(daily_seasonality=False, yearly_seasonality=False) prophet_model.add_seasonality(name='yearly', period=365.25, fourier_order=5) prophet_model.fit(train_df) future = prophet_model.make_future_dataframe(periods=len(test_df)) forecast = prophet_model.predict(future) กำหนด Seasonality ให้โมเดล Prophet เป็นปีละครั้ง เพื่อช่วยให้ Prophet รู้ช่วงที่มีข้อมููลซ้ำๆ และสามารถทำงานได้ดีขึ้น จากนั้น train โมเดลด้วยข้อมูลของ train_df สุดท้ายให้ Prophet ทำนายโดยใช้ข้อมูลจาก test_df ขั้นตอนที่ 3: สร้างโมเดล LSTM เพื่อพยากรณ์อุณหภูมิ เตรียมข้อมูลให้โมเดล LSTM from sklearn.preprocessing import MinMaxScaler from keras.models import Sequential from keras.layers import LSTM, Dense, Dropout scaler = MinMaxScaler() scaled_y = scaler.fit_transform(df['y'].values.reshape(-1,1)) ทำให้ข้อมูลอยู่ในรูปนะหว่าง -1 และ 1 เพื่อให้โมเดล LSTM ทำงานได้ง่ายขึ้น สร้างชุดข้อมูลลำดับเพื่อให้โมเดล LSTM เอามาทำนาย n_steps = 30 def create_sequences(data, n_steps): X, y = [], [] for i in range(n_steps, len(data)): X.append(data[i-n_steps:i]) y.append(data[i]) return np.array(X), np.array(y) X, y_lstm = create_sequences(scaled_y, n_steps) X_train, X_test = X[:train_size-n_steps], X[train_size-n_steps:] y_train, y_test = y_lstm[:train_size-n_steps], y_lstm[train_size-n_steps:] แปลงชุดข้อมูลให้เป็นลำดับ เพราะ LSTM ต้องการลำดับของข้อมูล สร้างชุดข้อมูลลำดับย้อนหลัง 30 วัน(n_steps = 30) มาให้โมเดล LSTM เอาไปทำนาย "วันถัดไป" สร้างโมเดล LSTM lstm_model = Sequential() lstm_model.add(LSTM(64, return_sequences=True, input_shape=(n_steps, 1))) lstm_model.add(Dropout(0.2)) lstm_model.add(LSTM(32)) lstm_model.add(Dropout(0.2)) lstm_model.add(Dense(1)) lstm_model.compile(optimizer='adam', loss='mse') lstm_model.fit(X_train, y_train, epochs=100, batch_size=16, verbose=1) สร้างโมเดลที่เป็นลำดับชั้น โดยลำดับการทำงานคือ Input ➔ LSTM(64) ➔ Dropout(0.2) ➔ LSTM(32) ➔ Dropout(0.2) ➔ Dense(1) ➔ Output LSTM(64) : เรียนรู้ลำดับข้อมูลจาก Input พร้อมส่งคืนลำดับข้อมูลทั้งหมด Dropout(0.2) : ลดการ overfitting ของโมเดล LSTM(32) : เรียนรู้ลำดับข้อมูลอีกรอบ แต่ส่งคืนค่าออกมาแค่ค่าเดียว Dropout(0.2) : ลดการ overfitting ของโมเดลอีกครั้ง Dense(1) : คำนวณแบบ Linear เพื่อทำนายข้อมูลแบบ Regression โดยฝึกทั้งหมด 100 รอบ (epochs=100) ตัวอย่าง พยากรณ์อุณหภูมิด้วย LSTM lstm_predictions = lstm_model.predict(X_test) lstm_predictions = scaler.inverse_transform(lstm_predictions) -ต้องมีการแปลงข้อมูลที่ทำนายออกมาในรูปนะหว่าง -1 และ 1 กลับไปเป็นองศาเหมือนเดิม ขั้นตอนที่ 4: เปรียบเทียบผลลัพธ์ระหว่างโมเดล Prophet และ LSTM plt.figure(figsize=(14,7)) plt.plot(df['ds'], df['y'], color='black', label='True Data') plt.plot(forecast['ds'], forecast['yhat'], color='blue', label='Prophet Forecast') plt.plot(test_df['ds'], lstm_predictions.flatten(), color='red', label='LSTM Forecast') plt.xlabel('Date') plt.ylabel('Temperature (C)') plt.title('Temperature Forecasting: Prophet vs LSTM') plt.legend() plt.grid(True) plt.show() โดยสีดำ คือ ข้อมูลจริง สีน้ำเงิน คือ การทำนายของ Prophet สีแดง คือ การทำนายของ LSTM ขั้นตอนที่ 5: เปรียบเทียบความแม่นยำระหว่างโมเดล Prophet และ LSTM ใช้ RMSE (Root Mean Square Error) ในการวัดความผิดพลาดของโมเดล และ MAE (Mean Absolute Error) ซึ่งทั้งสองการวัดยิ่งมีค่าน้อย ความแม่นยำก็ยิ่งสูง RMSE (Root Mean Square Error) from sklearn.metrics import mean_squared_error prophet_rmse = np.sqrt(mean_squared_error(test_df['y'], forecast['yhat'].iloc[train_size:])) lstm_rmse = np.sqrt(mean_squared_error(test_df['y'].values, lstm_predictions)) print(f'Prophet RMSE: {prophet_rmse:.2f}') print(f'LSTM RMSE: {lstm_rmse:.2f}') ผลลัพท์ MAE (Mean Absolute Error) from sklearn.metrics import mean_absolute_error prophet_mae = mean_absolute_error(test_
ในปัจจุบันนั้นการนำ AI มาใช้ในการพยากรณ์สภาพอากาศหรืออุณหภูมิ นั้นสามารถพบเห็นได้โดยทั่วไป และมีการใช้โมเดลที่หลากหลาย ในส่วนของบทความนี้จะเป็นเปรียบเทียบการทำงานในการพยากรณ์อุณหภูมิระหว่างโมเดล LSTM(Long Short-Term Memory) และ Prophet โดยใช้เป็นข้อมูลจำลองและรันโค้ด Python ผ่าน Colab ของ Google เพื่อดูว่าทั้งสองโมเดลทำงานต่างกันยังไง
โดยมีข้อมูล 2 ประเภทคือ
- วันที่
- อุณหภูมิเฉลี่ยของวัน
ขั้นตอนที่ 1: เตรียมข้อมูลที่จำเป็น
โดยการสร้างข้อมูลอุณหภูมิเฉลี่ยของวัน ที่มีการบวกลบแบบสุ่มเล็กน้อยเพื่อความสมจริง จำนวนทั้งหมด 730 วัน
import pandas as pd
import numpy as np
import matplotlib.pyplot as plt
np.random.seed(42)
days = pd.date_range(start="2025-01-01", periods=730)
temperature = 20 + 10 * np.sin(2 * np.pi * days.dayofyear / 365) + np.random.normal(0, 1, len(days))
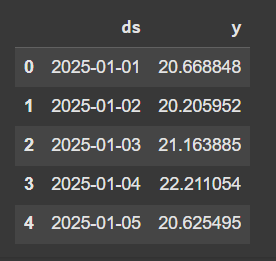
df = pd.DataFrame({'ds': days, 'y': temperature})
df.head()
ตัวอย่างตารางข้อมูล โดย ds: วันที่ และ y: อุณหภูมิเฉลี่ยของวัน
เขียนโค้ดเพื่อแบ่งข้อมูล: 80% สำหรับ Train โมเดลและ 20% สำหรับทดสอบโมเดล
train_size = int(len(df) * 0.8)
train_df = df[:train_size]
test_df = df[train_size:]
ขั้นตอนที่ 2: สร้างโมเดล Prophet เพื่อพยากรณ์อุณหภูมิ
from prophet import Prophet

prophet_model = Prophet(daily_seasonality=False, yearly_seasonality=False)
prophet_model.add_seasonality(name='yearly', period=365.25, fourier_order=5)
prophet_model.fit(train_df)

future = prophet_model.make_future_dataframe(periods=len(test_df))
forecast = prophet_model.predict(future)
- กำหนด Seasonality ให้โมเดล Prophet เป็นปีละครั้ง เพื่อช่วยให้ Prophet รู้ช่วงที่มีข้อมููลซ้ำๆ และสามารถทำงานได้ดีขึ้น
- จากนั้น train โมเดลด้วยข้อมูลของ train_df
- สุดท้ายให้ Prophet ทำนายโดยใช้ข้อมูลจาก test_df
ขั้นตอนที่ 3: สร้างโมเดล LSTM เพื่อพยากรณ์อุณหภูมิ
เตรียมข้อมูลให้โมเดล LSTM
from sklearn.preprocessing import MinMaxScaler
from keras.models import Sequential
from keras.layers import LSTM, Dense, Dropout

scaler = MinMaxScaler()
scaled_y = scaler.fit_transform(df['y'].values.reshape(-1,1))
- ทำให้ข้อมูลอยู่ในรูปนะหว่าง -1 และ 1 เพื่อให้โมเดล LSTM ทำงานได้ง่ายขึ้น
สร้างชุดข้อมูลลำดับเพื่อให้โมเดล LSTM เอามาทำนาย
n_steps = 30

def create_sequences(data, n_steps):
    X, y = [], []
    for i in range(n_steps, len(data)):
        X.append(data[i-n_steps:i])
        y.append(data[i])
    return np.array(X), np.array(y)

X, y_lstm = create_sequences(scaled_y, n_steps)
X_train, X_test = X[:train_size-n_steps], X[train_size-n_steps:]
y_train, y_test = y_lstm[:train_size-n_steps], y_lstm[train_size-n_steps:]
- แปลงชุดข้อมูลให้เป็นลำดับ เพราะ LSTM ต้องการลำดับของข้อมูล
- สร้างชุดข้อมูลลำดับย้อนหลัง 30 วัน(n_steps = 30) มาให้โมเดล LSTM เอาไปทำนาย "วันถัดไป"
สร้างโมเดล LSTM
lstm_model = Sequential()
lstm_model.add(LSTM(64, return_sequences=True, input_shape=(n_steps, 1)))
lstm_model.add(Dropout(0.2))
lstm_model.add(LSTM(32))
lstm_model.add(Dropout(0.2))
lstm_model.add(Dense(1))
lstm_model.compile(optimizer='adam', loss='mse')
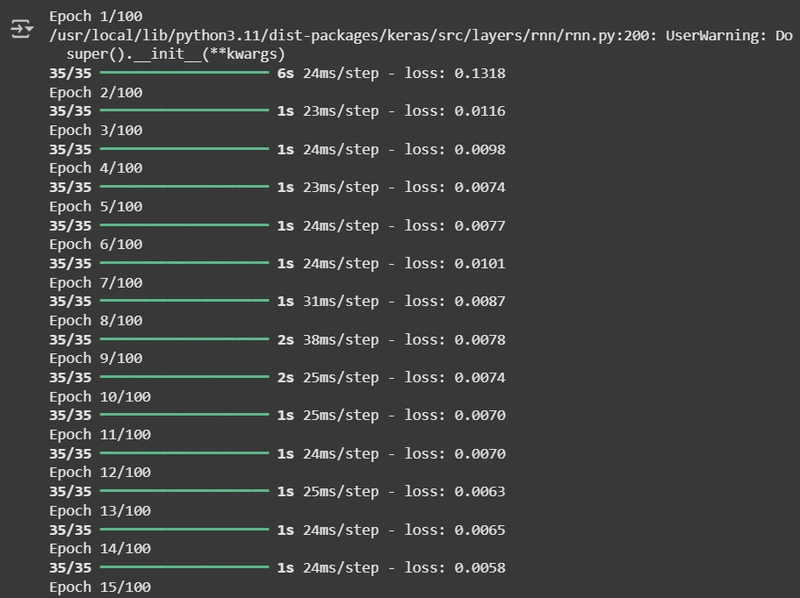
lstm_model.fit(X_train, y_train, epochs=100, batch_size=16, verbose=1)
- สร้างโมเดลที่เป็นลำดับชั้น โดยลำดับการทำงานคือ Input ➔ LSTM(64) ➔ Dropout(0.2) ➔ LSTM(32) ➔ Dropout(0.2) ➔ Dense(1) ➔ Output
- LSTM(64) : เรียนรู้ลำดับข้อมูลจาก Input พร้อมส่งคืนลำดับข้อมูลทั้งหมด
- Dropout(0.2) : ลดการ overfitting ของโมเดล
- LSTM(32) : เรียนรู้ลำดับข้อมูลอีกรอบ แต่ส่งคืนค่าออกมาแค่ค่าเดียว
- Dropout(0.2) : ลดการ overfitting ของโมเดลอีกครั้ง
- Dense(1) : คำนวณแบบ Linear เพื่อทำนายข้อมูลแบบ Regression
โดยฝึกทั้งหมด 100 รอบ (epochs=100)
ตัวอย่าง
พยากรณ์อุณหภูมิด้วย LSTM
lstm_predictions = lstm_model.predict(X_test)
lstm_predictions = scaler.inverse_transform(lstm_predictions)
-ต้องมีการแปลงข้อมูลที่ทำนายออกมาในรูปนะหว่าง -1 และ 1 กลับไปเป็นองศาเหมือนเดิม
ขั้นตอนที่ 4: เปรียบเทียบผลลัพธ์ระหว่างโมเดล Prophet และ LSTM
plt.figure(figsize=(14,7))

plt.plot(df['ds'], df['y'], color='black', label='True Data')

plt.plot(forecast['ds'], forecast['yhat'], color='blue', label='Prophet Forecast')

plt.plot(test_df['ds'], lstm_predictions.flatten(), color='red', label='LSTM Forecast')

plt.xlabel('Date')
plt.ylabel('Temperature (C)')
plt.title('Temperature Forecasting: Prophet vs LSTM')
plt.legend()
plt.grid(True)
plt.show()
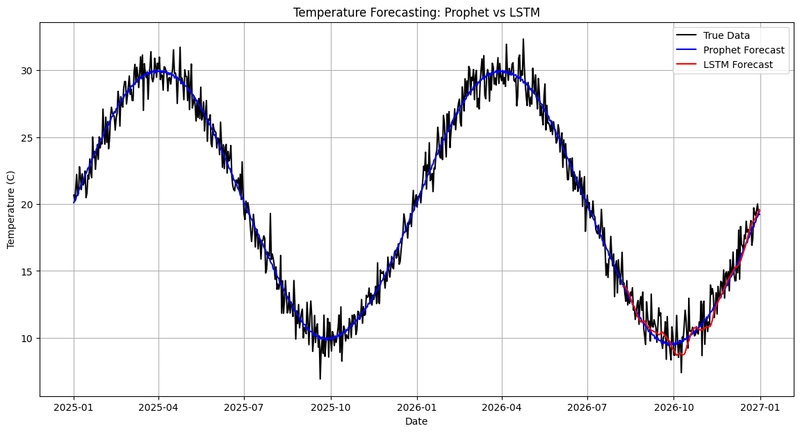
โดยสีดำ คือ ข้อมูลจริง
สีน้ำเงิน คือ การทำนายของ Prophet
สีแดง คือ การทำนายของ LSTM
ขั้นตอนที่ 5: เปรียบเทียบความแม่นยำระหว่างโมเดล Prophet และ LSTM
ใช้ RMSE (Root Mean Square Error) ในการวัดความผิดพลาดของโมเดล และ MAE (Mean Absolute Error) ซึ่งทั้งสองการวัดยิ่งมีค่าน้อย ความแม่นยำก็ยิ่งสูง
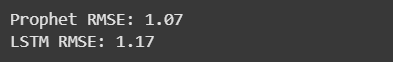
RMSE (Root Mean Square Error)
from sklearn.metrics import mean_squared_error

prophet_rmse = np.sqrt(mean_squared_error(test_df['y'], forecast['yhat'].iloc[train_size:]))
lstm_rmse = np.sqrt(mean_squared_error(test_df['y'].values, lstm_predictions))

print(f'Prophet RMSE: {prophet_rmse:.2f}')
print(f'LSTM RMSE: {lstm_rmse:.2f}')
ผลลัพท์
MAE (Mean Absolute Error)
from sklearn.metrics import mean_absolute_error

prophet_mae = mean_absolute_error(test_df['y'], forecast['yhat'].iloc[train_size:])
lstm_mae = mean_absolute_error(test_df['y'].values, lstm_predictions)

print(f'Prophet MAE: {prophet_mae:.2f}')
print(f'LSTM MAE: {lstm_mae:.2f}')
ผลลัพท์
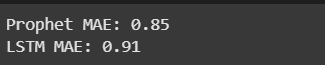
จะเห็นได้ว่า Prophet มีค่า RMSE และ MAE น้อยกว่าเล็กน้อย LSTM ซึ่งแปลว่า
Prophet มีความแม่นยำกว่า LSTM นิดหน่อย
สรุป
Prophet : ใช้งานง่าย เขียนโค้ดไม่ยุ่งยาก ต้องการข้อมูลไม่มาก และใช้เวลา train ไม่นาน เหมาะสมกับชุดข้อมูลที่ไม่ซับซ้อน
LSTM : ใช้งานยาก เขียนโค้ดเยอะ ต้องการข้อมูลจำนวนมาก และใช้เวลา train นาน แต่ก็มีอิสระในการปรับใช้กับงานได้หลายแบบ รวมถึงรับมือกับข้อมูลที่ซับซ้อนและ noise ได้ดี
เหตุผลที่ Prophet ชนะ LSTM ในการพยากรณ์อุณหภูมิ เพราะ ชุดข้อมูลจำลองนั้นมีซับซ้อนค่อนข้างน้อย และมีแนวโน้มที่ข้อมูลซ้ำกันค่อยข้างเยอะ ทำให้เข้าทางของ Prophet มากกว่า LSTM
Reference
Colab:https://colab.research.google.com/drive/1McbdpBufsrW865v68HoOfxIkCvzGomj0?usp=sharing