


![[The AI Show Episode 144]: ChatGPT’s New Memory, Shopify CEO’s Leaked “AI First” Memo, Google Cloud Next Releases, o3 and o4-mini Coming Soon & Llama 4’s Rocky Launch](https://www.marketingaiinstitute.com/hubfs/ep%20144%20cover.png)


![Is this too much for a modular monolith system? [closed]](https://i.sstatic.net/pYL1nsfg.png)


_Andreas_Prott_Alamy.jpg?width=1280&auto=webp&quality=80&disable=upscale#)


![What features do you get with Gemini Advanced? [April 2025]](https://i0.wp.com/9to5google.com/wp-content/uploads/sites/4/2024/02/gemini-advanced-cover.jpg?resize=1200%2C628&quality=82&strip=all&ssl=1)


![Apple Shares Official Trailer for 'Long Way Home' Starring Ewan McGregor and Charley Boorman [Video]](https://www.iclarified.com/images/news/97069/97069/97069-640.jpg)
![Apple Watch Series 10 Back On Sale for $299! [Lowest Price Ever]](https://www.iclarified.com/images/news/96657/96657/96657-640.jpg)
![EU Postpones Apple App Store Fines Amid Tariff Negotiations [Report]](https://www.iclarified.com/images/news/97068/97068/97068-640.jpg)
![Apple Slips to Fifth in China's Smartphone Market with 9% Decline [Report]](https://www.iclarified.com/images/news/97065/97065/97065-640.jpg)


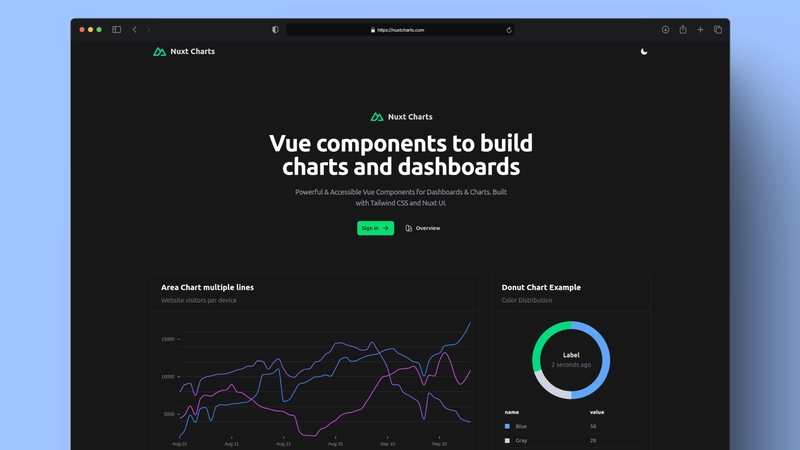
Why I'm Building Nuxt Charts
If you've spent time in both the React and Vue ecosystems, especially when building data-intensive applications, you might have noticed that the React world seems spoiled for choice when it comes to sleek, modern, and easy-to-integrate charting libraries. As a developer primarily working with Vue and Nuxt, I feel this gap is much larger than it should be. We need more sleek chart designs and other ways to visualize data effectively. Think of Tremor Labs; we all want to use it, but we can't. To create more options that combine great aesthetics with a smooth developer experience, I've created Nuxt Charts, a wrapper around vue-chrts—as a way to create beautiful charts in seconds. Nuxt Charts:
If you've spent time in both the React and Vue ecosystems, especially when building data-intensive applications, you might have noticed that the React world seems spoiled for choice when it comes to sleek, modern, and easy-to-integrate charting libraries.
As a developer primarily working with Vue and Nuxt, I feel this gap is much larger than it should be. We need more sleek chart designs and other ways to visualize data effectively. Think of Tremor Labs; we all want to use it, but we can't.
To create more options that combine great aesthetics with a smooth developer experience, I've created Nuxt Charts, a wrapper around vue-chrts—as a way to create beautiful charts in seconds.