


![[The AI Show Episode 142]: ChatGPT’s New Image Generator, Studio Ghibli Craze and Backlash, Gemini 2.5, OpenAI Academy, 4o Updates, Vibe Marketing & xAI Acquires X](https://www.marketingaiinstitute.com/hubfs/ep%20142%20cover.png)


![From drop-out to software architect with Jason Lengstorf [Podcast #167]](https://cdn.hashnode.com/res/hashnode/image/upload/v1743796461357/f3d19cd7-e6f5-4d7c-8bfc-eb974bc8da68.png?#)


.png?#)


_Christophe_Coat_Alamy.jpg?#)


.webp?#)


![Apple Considers Delaying Smart Home Hub Until 2026 [Gurman]](https://www.iclarified.com/images/news/96946/96946/96946-640.jpg)
![iPhone 17 Pro Won't Feature Two-Toned Back [Gurman]](https://www.iclarified.com/images/news/96944/96944/96944-640.jpg)
![Tariffs Threaten Apple's $999 iPhone Price Point in the U.S. [Gurman]](https://www.iclarified.com/images/news/96943/96943/96943-640.jpg)


Visualize System Metrics with Grafana & Prometheus in Docker
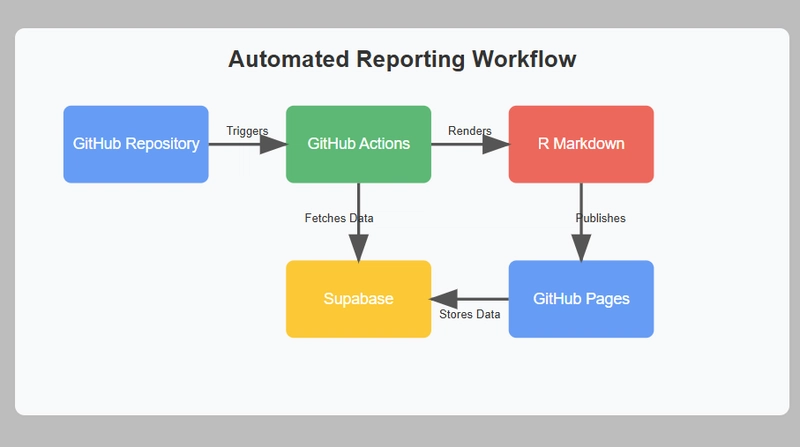
Follow the link to the Github Repo:- https://github.com/vak-rashu/Docker/tree/main/Prometheus-and-Grafana-with-Docker Prometheus and Grafana are two main tools that are used to monitor, analyse and visualise the metrics, logs or event traces from applications and services. Prometheus is a tool to get the metrics and logs from the application. While Grafana is used to convert those metrics into beautiful dashboards to visualise them. Node Exporter (Node means a system) is a tool to get the metrics, logs and related observations from the system it has been configured for. It provides the data in Prometheus format to Prometheus so that it can interfere it easily. In this article, we will create a dashboard using Grafana and Prometheus by taking from the Node Exporter, which will be downloaded in the local machine only. Download Node Exporter Follow the steps to download and run the node_exporter. mkdir node_exporter wget https://github.com/prometheus/node_exporter/releases/download/v1.9.0/node_exporter-1.9.0.linux-amd64.tar.gz tar xvfz node_exporter-1.9.0.linux-amd64 cd node_exporter-1.9.0.linux-amd64 ./node_exporter #this is will execute the service Configure the docker-compose.yml file to run Prometheus and Grafana. Create a docker-compose.yml Prometheus runs on port 9090 and Grafana on 3000. You can copy paste the same code to run in your machine. Note: Prometheus requires a prometheus.yml file that will be used to describe the jobs that prometheus has to get metrics for. This file is configured in /etc/prometheus/prometheus.yml . services: prometheus: image: prom/prometheus:latest ports: - "9090:9090" volumes: - ./prometheus.yml:/etc/prometheus/prometheus.yml - prom_data:/prometheus command: "--config.file=/etc/prometheus/prometheus.yml" grafana: image: grafana/grafana ports: - "3000:3000" environment: - GF_SECURITY_ADMIN_USER=admin - GF_SECURITY_ADMIN_PASSWORD=grafana volumes: - grafana_data:/var/lib/grafana volumes: prom_data: grafana_data: The above code will run the container but we also have to create the prometheus.yml file, which is as below:- --- global: scrape_interval: 15s scrape_configs: # The job name is added as a label `job=` to any timeseries scraped from this config. - job_name: 'rashu-ubuntu' # Override the global default and scrape targets from this job every 5 seconds. scrape_interval: 5s static_configs: - targets: ['172.16.0.4:9100'] This is the prometheus.yml file. Here, I want to get the metrics of the target set as "targets: ['172.16.0.4:9100']", which is actually where the Node Exporter is running on my service. You can configure it according to your ip address. Though you can also run Node Exporter as one of the container, but I think running it locally is much better. Now, run the docker compose up -d command and the node exporter, you will see that the Prometheus is running in port 9090 and Grafana in 3000. Then in Grafana go to, Data Sources> Select Prometheus> Enter the name whatever you want > in Connection, type http://prometheus:9090, (remember only enter the name of the domain name which should be correspond to the name of the service name you have given to prometheus in the docker-compose.yml file, like I have given it prometheus) > Click on Save and Test. Then go to Build a Dashboard> Add Visualisation> Select Data Source and start making the visualises as you want.
Follow the link to the Github Repo:- https://github.com/vak-rashu/Docker/tree/main/Prometheus-and-Grafana-with-Docker
Prometheus and Grafana are two main tools that are used to monitor, analyse and visualise the metrics, logs or event traces from applications and services.
Prometheus is a tool to get the metrics and logs from the application.
While Grafana is used to convert those metrics into beautiful dashboards to visualise them.
Node Exporter (Node means a system) is a tool to get the metrics, logs and related observations from the system it has been configured for. It provides the data in Prometheus format to Prometheus so that it can interfere it easily.
In this article, we will create a dashboard using Grafana and Prometheus by taking from the Node Exporter, which will be downloaded in the local machine only.
Download Node Exporter
Follow the steps to download and run the node_exporter.
mkdir node_exporter

wget https://github.com/prometheus/node_exporter/releases/download/v1.9.0/node_exporter-1.9.0.linux-amd64.tar.gz

tar xvfz node_exporter-1.9.0.linux-amd64

cd node_exporter-1.9.0.linux-amd64

./node_exporter #this is will execute the service
Configure the docker-compose.yml file to run Prometheus and Grafana.
Create a docker-compose.yml
Prometheus runs on port 9090 and Grafana on 3000. You can copy paste the same code to run in your machine.
Note: Prometheus requires a prometheus.yml file that will be used to describe the jobs that prometheus has to get metrics for. This file is configured in /etc/prometheus/prometheus.yml .
services:
    prometheus:
        image: prom/prometheus:latest
        ports:
          - "9090:9090"
        volumes:
          - ./prometheus.yml:/etc/prometheus/prometheus.yml
          - prom_data:/prometheus
        command: "--config.file=/etc/prometheus/prometheus.yml"

    grafana:
      image: grafana/grafana
      ports:
        - "3000:3000"
      environment:
        - GF_SECURITY_ADMIN_USER=admin
        - GF_SECURITY_ADMIN_PASSWORD=grafana
      volumes:
        - grafana_data:/var/lib/grafana

volumes:
   prom_data:
   grafana_data:
The above code will run the container but we also have to create the prometheus.yml file, which is as below:-
---
global:
  scrape_interval: 15s

scrape_configs:
  # The job name is added as a label `job=` to any timeseries scraped from this config.
  - job_name: 'rashu-ubuntu'
    # Override the global default and scrape targets from this job every 5 seconds.
    scrape_interval: 5s
    static_configs:
      - targets: ['172.16.0.4:9100']
This is the prometheus.yml file. Here, I want to get the metrics of the target set as "targets: ['172.16.0.4:9100']", which is actually where the Node Exporter is running on my service. You can configure it according to your ip address.
Though you can also run Node Exporter as one of the container, but I think running it locally is much better.
Now, run the docker compose up -d command and the node exporter, you will see that the Prometheus is running in port 9090 and Grafana in 3000.
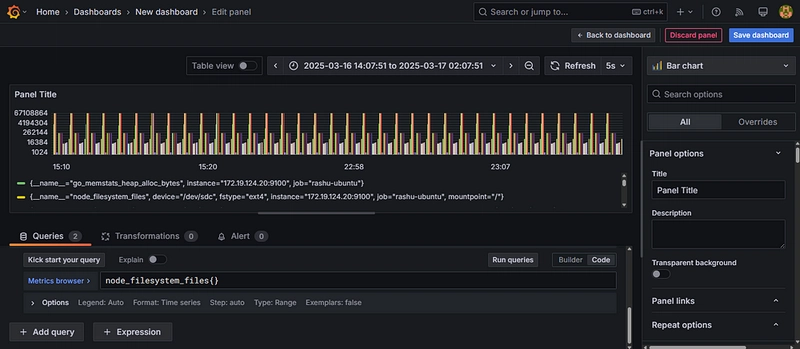
Then in Grafana go to, Data Sources> Select Prometheus> Enter the name whatever you want > in Connection, type http://prometheus:9090, (remember only enter the name of the domain name which should be correspond to the name of the service name you have given to prometheus in the docker-compose.yml file, like I have given it prometheus) > Click on Save and Test.
Then go to Build a Dashboard> Add Visualisation> Select Data Source and start making the visualises as you want.