Unlocking Hidden Performance Bottlenecks in Golang using GoFr: The Underrated Power of pprof
In high-traffic production environments, unexpected performance bottlenecks can degrade user experience and threaten system reliability. While GoFr, a powerful Golang framework, offers built-in observability, some issues demand deeper debugging to pinpoint the exact lines of code causing slowdowns. This is where pprof—an underrated yet potent tool—shines, delivering real-time performance profiling and actionable insights. The Challenge of Debugging Performance Issues in Golang Golang services are built for speed, but at scale, even small inefficiencies can snowball into significant performance hits. Debugging these issues is tricky because: Traditional logs and traces provide historical data but can’t capture real-time bottlenecks. Problems like CPU spikes, memory leaks, and goroutine contention require live profiling to diagnose effectively. Many profiling tools demand complex setup or risk destabilizing production environments. How GoFr & pprof Solve This Quickly GoFr simplifies observability with integrated logging, monitoring, and metrics (visualizable via tools like Grafana). For deeper debugging, it pairs seamlessly with pprof, enabling developers to: Quickly Enable Profiling: With a simple config tweak in GoFr, unlock real-time CPU, memory, and goroutine profiling. Analyze Performance in Production: Diagnose high-latency endpoints without downtime, thanks to pprof’s runtime capabilities. Optimize for Peak Traffic: Spot inefficient operations—like JSON decoding, mutex contention, or costly database calls—and address them proactively. pprof in GoFr In GoFr applications, pprof profiling is built-in and accessible via the METRICS_PORT (defaulting to 2121 if unspecified). This dedicated port isolates profiling endpoints from your main application, enhancing security. Access them at: CPU Profiling: :2121/debug/pprof/profile Memory Profiling: :2121/debug/pprof/heap Goroutine Analysis: :2121/debug/pprof/goroutine Using data collected from these endpoints, developers can generate detailed CPU profiles and flamegraphs to visualize performance bottlenecks. CPU Profile (Call Graph) A CPU call graph illustrates how functions execute and interconnect at runtime: Nodes: Represent functions. Edges: Show function calls between them. This view is ideal for understanding program flow and dependencies. Flamegraph A flamegraph highlights CPU usage visually with stacked bars: X-axis: Function execution time (wider bars mean more time spent). Y-axis: Call hierarchy (higher stacks indicate deeper calls). It’s a fast way to spot performance hotspots and prioritize optimizations. Key Differences CPU Call Graph: Emphasizes function relationships and execution order. Flamegraph: Pinpoints CPU-intensive functions and bottlenecks. Real-World Use Case: Debugging Latency Spikes in a Golang Service Imagine a Go-based service hit by latency spikes during peak traffic. Standard monitoring (logs, GoFr’s metrics in Grafana) flags high API response times, but the root cause stays elusive. A common culprit? Inefficient JSON decoding, where json.Unmarshal() chews up CPU via reflection. Without profiling, this is a needle in a haystack. Here’s how pprof saves the day: Identify the Problem Using Grafana: GoFr’s metrics, visualized in Grafana, show elevated response times. Uneven load distribution suggests concurrency issues. Run Real-Time Profiling with pprof: Enable pprof in GoFr with a config change. Collect CPU and memory profiles during peak load, then analyze them with go tool pprof. Pinpoint the Bottleneck: Profiling reveals json.Unmarshal() as a CPU hog due to reflection-based unmarshaling—slowing down requests significantly. Apply Optimizations & Measure Impact: Swap encoding/json for jsoniter (a high-performance JSON library). Cut API latency by 30%. Deploy safely with feature flags and confirm gains in Grafana. Why This Approach Is a Game-Changer for Golang Developers Minimal Setup: GoFr enables pprof with a single config tweak—no complex integrations. Live Debugging Without Downtime: Profile production systems in real-time using pprof’s runtime capabilities. Pinpoint Slow Code Paths: Uncover inefficient functions dragging down performance. Optimize Safely: Roll out fixes with confidence using controlled deployments. Final Thoughts Performance debugging in Golang doesn’t have to be a mystery. By combining GoFr’s observability with pprof’s profiling power, developers can expose hidden inefficiencies and tune services for peak performance at scale. Have you tackled JSON decoding bottlenecks with pprof—or found other sneaky slowdowns? Share your experiences in the comments!
In high-traffic production environments, unexpected performance bottlenecks can degrade user experience and threaten system reliability. While GoFr, a powerful Golang framework, offers built-in observability, some issues demand deeper debugging to pinpoint the exact lines of code causing slowdowns. This is where pprof—an underrated yet potent tool—shines, delivering real-time performance profiling and actionable insights.
The Challenge of Debugging Performance Issues in Golang
Golang services are built for speed, but at scale, even small inefficiencies can snowball into significant performance hits. Debugging these issues is tricky because:
- Traditional logs and traces provide historical data but can’t capture real-time bottlenecks.
- Problems like CPU spikes, memory leaks, and goroutine contention require live profiling to diagnose effectively.
- Many profiling tools demand complex setup or risk destabilizing production environments.
How GoFr & pprof Solve This Quickly
GoFr simplifies observability with integrated logging, monitoring, and metrics (visualizable via tools like Grafana). For deeper debugging, it pairs seamlessly with pprof, enabling developers to:
- Quickly Enable Profiling: With a simple config tweak in GoFr, unlock real-time CPU, memory, and goroutine profiling.
- Analyze Performance in Production: Diagnose high-latency endpoints without downtime, thanks to pprof’s runtime capabilities.
- Optimize for Peak Traffic: Spot inefficient operations—like JSON decoding, mutex contention, or costly database calls—and address them proactively.
pprof in GoFr
In GoFr applications, pprof profiling is built-in and accessible via the METRICS_PORT (defaulting to 2121 if unspecified). This dedicated port isolates profiling endpoints from your main application, enhancing security. Access them at:
-
CPU Profiling:
:2121/debug/pprof/profile -
Memory Profiling:
:2121/debug/pprof/heap -
Goroutine Analysis:
:2121/debug/pprof/goroutine
Using data collected from these endpoints, developers can generate detailed CPU profiles and flamegraphs to visualize performance bottlenecks.
CPU Profile (Call Graph)
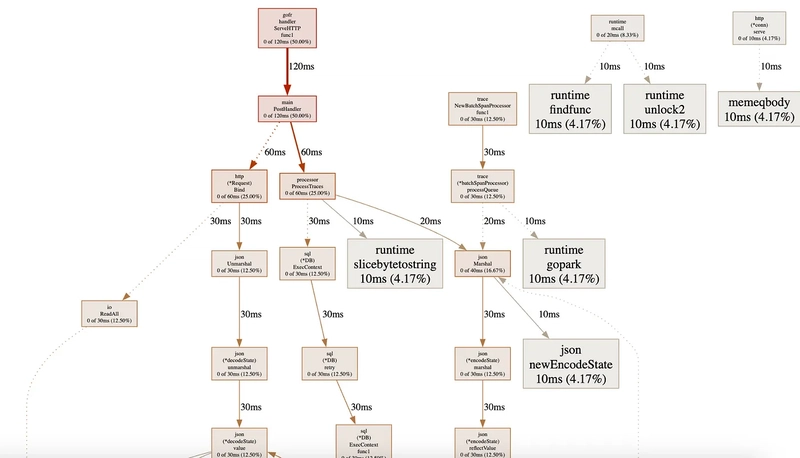
A CPU call graph illustrates how functions execute and interconnect at runtime:
- Nodes: Represent functions.
- Edges: Show function calls between them.
This view is ideal for understanding program flow and dependencies.
Flamegraph
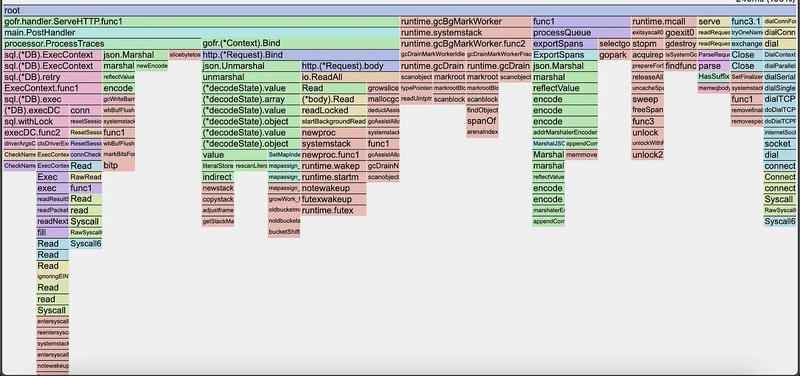
A flamegraph highlights CPU usage visually with stacked bars:
- X-axis: Function execution time (wider bars mean more time spent).
- Y-axis: Call hierarchy (higher stacks indicate deeper calls).
It’s a fast way to spot performance hotspots and prioritize optimizations.
Key Differences
- CPU Call Graph: Emphasizes function relationships and execution order.
- Flamegraph: Pinpoints CPU-intensive functions and bottlenecks.
Real-World Use Case: Debugging Latency Spikes in a Golang Service
Imagine a Go-based service hit by latency spikes during peak traffic. Standard monitoring (logs, GoFr’s metrics in Grafana) flags high API response times, but the root cause stays elusive. A common culprit? Inefficient JSON decoding, where json.Unmarshal() chews up CPU via reflection. Without profiling, this is a needle in a haystack. Here’s how pprof saves the day:
- Identify the Problem Using Grafana: GoFr’s metrics, visualized in Grafana, show elevated response times. Uneven load distribution suggests concurrency issues.
-
Run Real-Time Profiling with pprof: Enable pprof in GoFr with a config change. Collect CPU and memory profiles during peak load, then analyze them with
go tool pprof. -
Pinpoint the Bottleneck: Profiling reveals
json.Unmarshal()as a CPU hog due to reflection-based unmarshaling—slowing down requests significantly. -
Apply Optimizations & Measure Impact: Swap
encoding/jsonforjsoniter(a high-performance JSON library). Cut API latency by 30%. Deploy safely with feature flags and confirm gains in Grafana.
Why This Approach Is a Game-Changer for Golang Developers
- Minimal Setup: GoFr enables pprof with a single config tweak—no complex integrations.
- Live Debugging Without Downtime: Profile production systems in real-time using pprof’s runtime capabilities.
- Pinpoint Slow Code Paths: Uncover inefficient functions dragging down performance.
- Optimize Safely: Roll out fixes with confidence using controlled deployments.
Final Thoughts
Performance debugging in Golang doesn’t have to be a mystery. By combining GoFr’s observability with pprof’s profiling power, developers can expose hidden inefficiencies and tune services for peak performance at scale.
Have you tackled JSON decoding bottlenecks with pprof—or found other sneaky slowdowns? Share your experiences in the comments!









![[The AI Show Episode 142]: ChatGPT’s New Image Generator, Studio Ghibli Craze and Backlash, Gemini 2.5, OpenAI Academy, 4o Updates, Vibe Marketing & xAI Acquires X](https://www.marketingaiinstitute.com/hubfs/ep%20142%20cover.png)






















![[DEALS] The Premium Learn to Code Certification Bundle (97% off) & Other Deals Up To 98% Off – Offers End Soon!](https://www.javacodegeeks.com/wp-content/uploads/2012/12/jcg-logo.jpg)


![From drop-out to software architect with Jason Lengstorf [Podcast #167]](https://cdn.hashnode.com/res/hashnode/image/upload/v1743796461357/f3d19cd7-e6f5-4d7c-8bfc-eb974bc8da68.png?#)











.png?#)


.jpg?#)


![iPhone 17 Pro Won't Feature Two-Toned Back [Gurman]](https://www.iclarified.com/images/news/96944/96944/96944-640.jpg)





_Christophe_Coat_Alamy.jpg?#)
 (1).webp?#)


![Tariffs Threaten Apple's $999 iPhone Price Point in the U.S. [Gurman]](https://www.iclarified.com/images/news/96943/96943/96943-640.jpg)


