


![[The AI Show Episode 142]: ChatGPT’s New Image Generator, Studio Ghibli Craze and Backlash, Gemini 2.5, OpenAI Academy, 4o Updates, Vibe Marketing & xAI Acquires X](https://www.marketingaiinstitute.com/hubfs/ep%20142%20cover.png)


![From drop-out to software architect with Jason Lengstorf [Podcast #167]](https://cdn.hashnode.com/res/hashnode/image/upload/v1743796461357/f3d19cd7-e6f5-4d7c-8bfc-eb974bc8da68.png?#)


![Switch 2 Pre-Order Rules Are Some BS: Here's How They Work [Update]](https://i.kinja-img.com/image/upload/c_fill,h_675,pg_1,q_80,w_1200/485ec87fd3cea832387b2699e4cbd2a1.jpg)


.png?#)


(1).jpg?width=1920&height=1920&fit=bounds&quality=80&format=jpg&auto=webp#)


-Mario-Kart-World-Hands-On-Preview-Is-It-Good-00-08-36.jpg?width=1920&height=1920&fit=bounds&quality=80&format=jpg&auto=webp#)


_NicoElNino_Alamy.png?#)
_Igor_Mojzes_Alamy.jpg?#)

.webp?#)
.webp?#)


![Blackmagic Design Unveils DaVinci Resolve 20 With Over 100 New Features and AI Tools [Video]](https://www.iclarified.com/images/news/96951/96951/96951-640.jpg)


![Apple Considers Delaying Smart Home Hub Until 2026 [Gurman]](https://www.iclarified.com/images/news/96946/96946/96946-640.jpg)


SNMP Monitoring: The Complete Guide
What Is SNMP? Simple Network Management Protocol (SNMP) represents one of networking's most enduring standards, serving as the backbone of infrastructure visibility since 1988. Unlike proprietary monitoring solutions, SNMP created a universal language allowing IT teams to decode the operational state of network hardware regardless of manufacturer. At its core, SNMP solved a critical problem in expanding networks: the ability to consistently monitor heterogeneous environments. Formalized by the Internet Engineering Task Force in RFC 1157, this protocol broke new ground by establishing standardized methods for querying device statistics, collecting performance metrics, and receiving event notifications across multi-vendor environments. How SNMP Monitoring Works SNMP monitoring is built on the interaction between software components—a manager and an agent. This client-server architecture enables efficient data collection from all devices in your network inventory. SNMP works as follows: The SNMP manager (monitoring server) sends requests for information to agents installed on network devices The SNMP agent (pre-installed on most network devices) processes the request and sends the requested data back to the manager In addition to responding to requests, the agent can proactively send notifications (TRAPs) when certain events occur, such as a port failure or when a CPU load threshold is reached The SNMP architecture enables active monitoring through regular polling and reactive monitoring through notifications (traps), making it flexible and effective for most network infrastructure monitoring scenarios. Components of SNMP Monitoring For comprehensive monitoring, SNMP uses several interconnected components: SNMP Manager The central component of the monitoring system that polls network devices and collects responses. Also known as a Network Management Station (NMS). This role can be fulfilled by specialized monitoring software or a distributed metric collection system. SNMP Agent A software client pre-installed on most network devices. The agent stores information about the device's state and sends it to the manager upon request or when certain events occur. Managed Device Network equipment on which the SNMP agent is installed, enabled, and configured. These can be routers, switches, firewalls, wireless access points, and other elements of network infrastructure. Management Information Base (MIB) A hierarchically structured dictionary of information about the device. Each entry in the MIB contains an Object Identifier (OID) and its human-readable definition. The MIB defines what data is available for monitoring on a specific device. Object Identifier (OID) A unique identifier for a specific parameter on a device. An OID is represented as a sequence of numbers separated by dots (e.g., 1.3.6.1.2.1.1.3.0 for uptime). OIDs can represent both measurable data (CPU load, fan speed, temperature) and configurable parameters (maximum bandwidth, device name). These components work together, allowing network engineers to obtain valuable information from any network device in a standardized format. SNMP Commands The SNMP manager uses a set of standard commands to interact with agents on network devices. These commands form the foundation of SNMP monitoring operations: Request Commands Get — Requests a specific OID value from an agent. The manager precisely identifies which information it needs. GetNext — Requests the next OID in the MIB hierarchy, enabling efficient sequential data collection without knowing all OIDs in advance. GetBulk — Retrieves multiple values in a single request, reducing network overhead. This command was introduced in SNMPv2 and dramatically improves polling efficiency. Set — Modifies device configurations remotely. This command requires write permissions and is typically restricted for security reasons. Response and Notification Commands Response — The agent's reply to a manager's request, containing the requested OID data extracted from the device's MIB. Trap — An agent-initiated alert for specific events or thresholds. For example, a device might send a Trap when CPU usage exceeds 80% for one minute, enabling proactive issue detection. Inform — An enhanced version of Trap with delivery confirmation. The manager acknowledges receipt, ensuring critical alerts aren't missed. This reliability improvement was introduced in SNMPv2. Understanding these commands is essential for implementing effective SNMP monitoring and troubleshooting network management systems. SNMP v1, v2c, and v3: Protocol Evolution Since its creation, the SNMP protocol has gone through several versions, each adding new capabilities and improving security: SNMPv1 The first version of the protocol, introduced in 1988. Key characteristics: Authentication using plai
What Is SNMP?
Simple Network Management Protocol (SNMP) represents one of networking's most enduring standards, serving as the backbone of infrastructure visibility since 1988. Unlike proprietary monitoring solutions, SNMP created a universal language allowing IT teams to decode the operational state of network hardware regardless of manufacturer.
At its core, SNMP solved a critical problem in expanding networks: the ability to consistently monitor heterogeneous environments. Formalized by the Internet Engineering Task Force in RFC 1157, this protocol broke new ground by establishing standardized methods for querying device statistics, collecting performance metrics, and receiving event notifications across multi-vendor environments.
How SNMP Monitoring Works
SNMP monitoring is built on the interaction between software components—a manager and an agent. This client-server architecture enables efficient data collection from all devices in your network inventory.
SNMP works as follows:
- The SNMP manager (monitoring server) sends requests for information to agents installed on network devices
- The SNMP agent (pre-installed on most network devices) processes the request and sends the requested data back to the manager
- In addition to responding to requests, the agent can proactively send notifications (TRAPs) when certain events occur, such as a port failure or when a CPU load threshold is reached
The SNMP architecture enables active monitoring through regular polling and reactive monitoring through notifications (traps), making it flexible and effective for most network infrastructure monitoring scenarios.
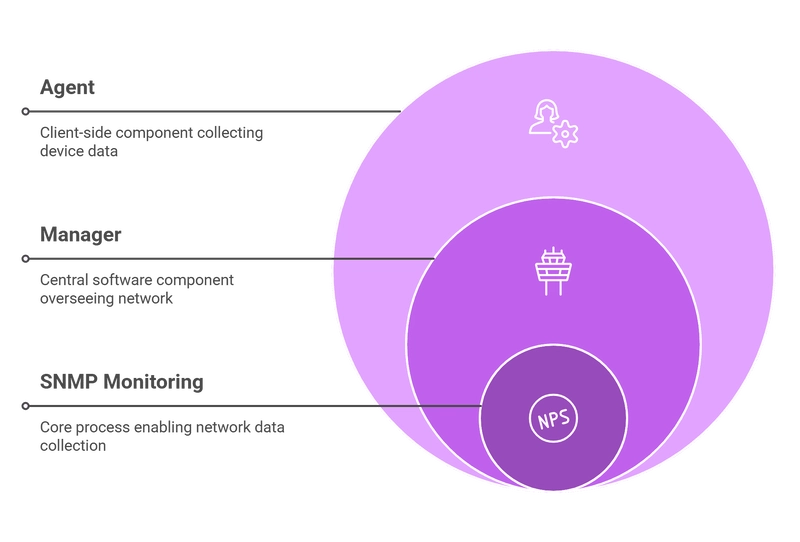
Components of SNMP Monitoring
For comprehensive monitoring, SNMP uses several interconnected components:
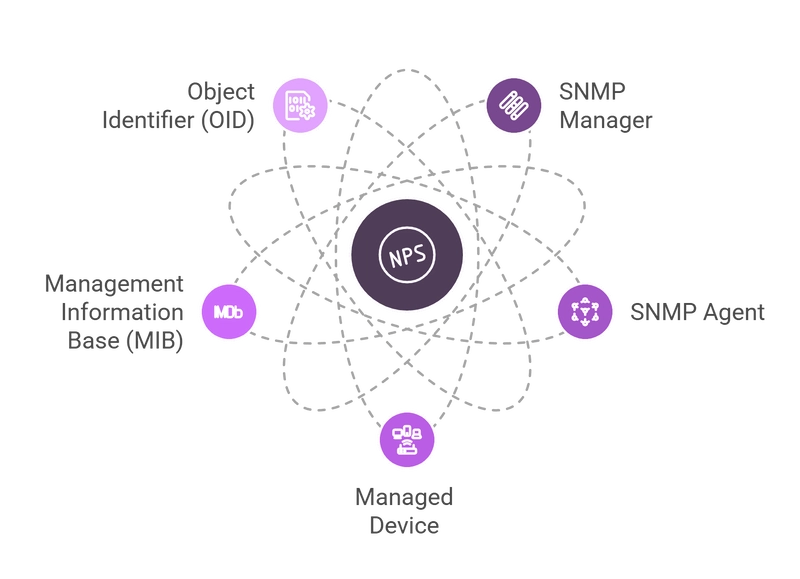
SNMP Manager
The central component of the monitoring system that polls network devices and collects responses. Also known as a Network Management Station (NMS). This role can be fulfilled by specialized monitoring software or a distributed metric collection system.
SNMP Agent
A software client pre-installed on most network devices. The agent stores information about the device's state and sends it to the manager upon request or when certain events occur.
Managed Device
Network equipment on which the SNMP agent is installed, enabled, and configured. These can be routers, switches, firewalls, wireless access points, and other elements of network infrastructure.
Management Information Base (MIB)
A hierarchically structured dictionary of information about the device. Each entry in the MIB contains an Object Identifier (OID) and its human-readable definition. The MIB defines what data is available for monitoring on a specific device.
Object Identifier (OID)
A unique identifier for a specific parameter on a device. An OID is represented as a sequence of numbers separated by dots (e.g., 1.3.6.1.2.1.1.3.0 for uptime). OIDs can represent both measurable data (CPU load, fan speed, temperature) and configurable parameters (maximum bandwidth, device name).
These components work together, allowing network engineers to obtain valuable information from any network device in a standardized format.
SNMP Commands
The SNMP manager uses a set of standard commands to interact with agents on network devices. These commands form the foundation of SNMP monitoring operations:
Request Commands
Get — Requests a specific OID value from an agent. The manager precisely identifies which information it needs.
GetNext — Requests the next OID in the MIB hierarchy, enabling efficient sequential data collection without knowing all OIDs in advance.
GetBulk — Retrieves multiple values in a single request, reducing network overhead. This command was introduced in SNMPv2 and dramatically improves polling efficiency.
Set — Modifies device configurations remotely. This command requires write permissions and is typically restricted for security reasons.
Response and Notification Commands
Response — The agent's reply to a manager's request, containing the requested OID data extracted from the device's MIB.
Trap — An agent-initiated alert for specific events or thresholds. For example, a device might send a Trap when CPU usage exceeds 80% for one minute, enabling proactive issue detection.
Inform — An enhanced version of Trap with delivery confirmation. The manager acknowledges receipt, ensuring critical alerts aren't missed. This reliability improvement was introduced in SNMPv2.
Understanding these commands is essential for implementing effective SNMP monitoring and troubleshooting network management systems.
SNMP v1, v2c, and v3: Protocol Evolution
Since its creation, the SNMP protocol has gone through several versions, each adding new capabilities and improving security:
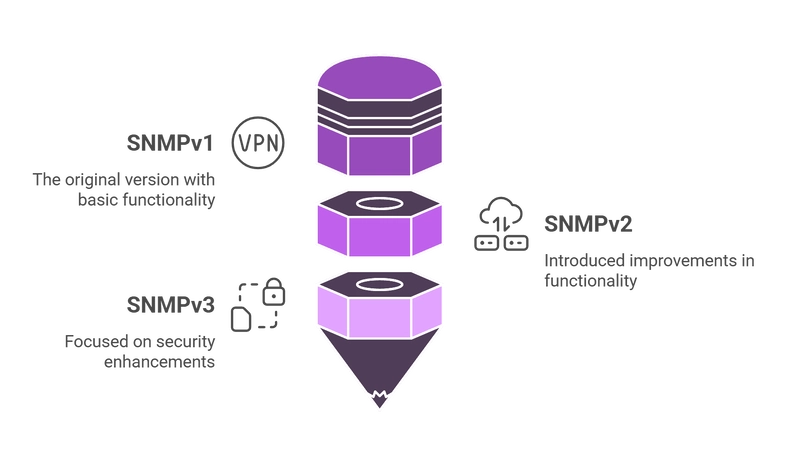
SNMPv1
The first version of the protocol, introduced in 1988. Key characteristics:
- Authentication using plain-text community strings
- Support for only 32-bit counters, limiting their maximum value to approximately 4.3 billion
- No data encryption
- Basic command set (Get, GetNext, Set)
The shortcomings of SNMPv1 became particularly noticeable with the growth of networks and increased security requirements.
SNMPv2c
An improved version that remains popular to this day. Key improvements:
- Introduction of 64-bit counters, allowing for the measurement of large volumes of traffic without overflow
- New commands, including GetBulk for obtaining multiple values in a single request
- Addition of the Inform command for reliable notification delivery
- Improved error handling
However, SNMPv2c still uses unsecured community strings for authentication.
SNMPv3
The most secure version of the protocol, introduced in 1998. Key improvements:
- User-based authentication using username and password
- Encryption of transmitted data to prevent interception
- Protection against replay and message modification attacks
- Access control based on views and models
SNMPv3 significantly enhances security through the User-based Security Model (USM) as described in detail in Cisco's SNMP Version 3 documentation. This version addresses the critical security limitations of earlier versions through encryption, authentication, and access control
Essential SNMP Metrics
SNMP provides access to a wide range of network device metrics. Below are the most important categories of data that can be collected using this protocol:
Interface Performance
- Bandwidth: Inbound and outbound traffic volumes
- Errors and discarded packets: Indicators of potential network issues
- Interface utilization percentage: How much of available bandwidth is being used
- Interface status: Whether ports are active (up) or inactive (down)
System Resources
- CPU load: Processing utilization across device components
- Memory usage: RAM allocation and availability
- Disk space usage: Storage capacity monitoring for devices with file systems
- Component temperatures: Thermal readings to prevent overheating
- Fan speeds: Cooling system performance indicators
Availability and Uptime
- Device uptime: Duration since last reboot or restart
- Status of critical services: Health of essential network services
- Response time: Latency measurement for network communications
Equipment-Specific Metrics
- Battery status in UPS systems: Power backup health monitoring
- Toner levels in printers: Print resource management
- RAID array status: Storage redundancy health
- Module status in modular systems: Health of plug-in components
Network Indicators
- Routing tables: Paths for network traffic
- BGP/OSPF sessions and their status: Routing protocol health
- VLAN status: Virtual network configuration information
- MAC address tables: Physical address mappings
Modern monitoring systems not only collect these metrics but also analyze trends over time, visualize them on interactive dashboards, and alert on threshold violations to ensure optimal network performance.
Key Takeaways
✓ SNMP provides a standardized way to collect performance and status data from network devices regardless of manufacturer.
✓ The SNMP architecture consists of managers, agents, and managed devices, using a structured MIB with OIDs to identify specific data points.
✓ Protocol versions (v1, v2c, v3) offer different levels of functionality and security, with SNMPv3 providing the strongest security features.
✓ Uptrace integrates SNMP monitoring with modern observability approaches to provide a complete picture of your IT infrastructure.
Setting Up SNMP Monitoring in Practice
Implementing SNMP monitoring might seem like a complex task, especially in heterogeneous environments with equipment from various manufacturers. Below are the main steps for setting up effective SNMP monitoring:
Configuration Example
# Basic SNMP configuration for network devices

# For Cisco IOS devices:
snmp-server community YOUR_COMMUNITY_STRING RO
snmp-server location "Data Center A, Rack 1"
snmp-server contact admin@example.com

# For SNMPv3 on Cisco devices:
snmp-server group SNMP_GROUP v3 priv
snmp-server user SNMP_USER SNMP_GROUP v3 auth sha AUTH_PASSWORD priv aes 128 PRIV_PASSWORD

# For Linux servers (in /etc/snmp/snmpd.conf):
rocommunity YOUR_COMMUNITY_STRING
syslocation "Data Center B, Rack 3"
syscontact admin@example.com

# SNMP Trap configuration:
trap2sink YOUR_TRAP_SERVER_IP YOUR_TRAP_COMMUNITY
Deployment Steps
- Planning
- Identify the devices that need to be monitored
- Choose the SNMP version (v3 is recommended for security)
- Plan the monitoring architecture, including the location of SNMP managers
- Develop a security policy for SNMP access
- Agent Configuration
- Enable SNMP on all devices
- Configure community strings or SNMPv3 credentials
- Set up SNMP Traps for event-based monitoring
- Manager Setup
- Install and configure a monitoring platform that supports SNMP
- Add devices by IP addresses or ranges
- Import necessary MIB files for specific devices
-
Alert Configuration
- Define threshold values for key metrics (e.g., >80% CPU usage)
- Create different alert levels (informational, warning, critical)
- Set up alert escalation for critical notifications
Deployment Models for SNMP Monitoring
Centralized Model
In a centralized model, a single SNMP manager collects data from all devices. Benefits include:
- Simplified management of the monitoring system
- Consolidated view of the entire network
- Reduced configuration overhead
This model works well for smaller networks but may face scalability challenges as the network grows.
Distributed Model
In a distributed model, multiple SNMP managers collect data from device subsets. Advantages include:
- Improved scalability for large networks
- Reduced network traffic in each segment
- Enhanced fault tolerance
This approach is recommended for large enterprises with geographically distributed networks.
Hierarchical Model
A hierarchical model combines elements of both approaches:
- Local SNMP managers collect data from nearby devices
- Regional managers aggregate data from local managers
- A central manager provides a unified view
This model offers the best balance of scalability and centralized management for complex networks.
Common SNMP Issues and Solutions
When implementing and operating SNMP monitoring, certain problems frequently arise. Knowing these issues and how to resolve them will help you create a reliable monitoring system:
Problem: Unable to Get Data from a Device
Possible Causes and Solutions:
- Incorrect community string or credentials — Check authentication settings on the device and in the monitoring system
- SNMP traffic blocked by a firewall — Ensure that UDP port 161 (for requests) and 162 (for traps) are open
- Incorrect SNMP version — Check which SNMP version is configured on the device and use the corresponding version in requests
- SNMP agent not running — Check the status of the SNMP service on the device and restart it if necessary
Problem: High Network Load Due to SNMP
Possible Causes and Solutions:
- Too frequent device polling — Increase the interval between polls for non-critical metrics
- Requesting too many OIDs — Optimize the set of requested data, focusing on truly necessary metrics
- Inefficient use of GetBulk — Configure GetBulk parameters to obtain an optimal amount of data in a single request
- Excessive number of SNMP managers — Consolidate data collection through fewer managers
Problem: Missed SNMP Traps
Possible Causes and Solutions:
- Incorrect trap receiver configuration — Check settings on the device and in the monitoring system
- UDP traffic blocking — Ensure that UDP port 162 is open throughout the path between the device and the trap receiver
- Trap receiver overload — Configure filtering or increase monitoring server resources
- UDP transmission issues — Consider using Inform instead of Trap for critical notifications
Integrating SNMP with Monitoring Systems
SNMP is rarely used in isolation. The protocol brings the most value when integrated with comprehensive monitoring and observability systems. Let's look at how SNMP combines with other technologies:
SNMP and OpenTelemetry
OpenTelemetry is a set of APIs, libraries, and agents for collecting traces, metrics, and logs from applications. Integrating SNMP with OpenTelemetry allows:
- Combining network infrastructure data with application metrics
- Creating a unified observability system for the entire IT environment
- Correlating network problems with application issues
SNMP and Distributed Tracing
Distributed tracing tracks requests through a microservice architecture. Combining SNMP data with tracing allows:
- Determining whether performance problems were caused by network devices
- Seeing the complete picture of a request's journey from the client through the network to the application and back
- Accelerating root cause identification of incidents
SNMP Monitoring with Uptrace
Uptrace offers a modern approach to network infrastructure monitoring, integrating SNMP data with distributed tracing and application metrics in a unified observability platform. This provides a holistic view of your IT environment and accelerates problem diagnosis.
Benefits of Using Uptrace for SNMP Monitoring:
- Unified Observability Platform
- Integration of SNMP data with metrics, logs, and tracing
- Correlation of network problems with application issues
- Single interface for all teams (DevOps, NetOps, SRE)
- Powerful Visualization
- Interactive dashboards for monitoring network devices
- Performance graphs with long-term trends
- Heat maps for quickly identifying problematic devices and interfaces
- Intelligent Data Processing
- Automatic anomaly detection in network metrics
- Trend prediction for proactive resource management
- Contextualization of SNMP data with other telemetry sources
- Flexible Alert System
- Customizable thresholds for different device types
- Integration with popular alert systems (PagerDuty, Slack, etc.)
- Reduced alert noise through grouping and intelligent filtering
-
Scalability and Performance
- Efficient SNMP data collection from thousands of devices
- Optimized metric storage for long-term analysis
- High query performance even on large volumes of data
Integration with OpenTelemetry:
Uptrace is deeply integrated with OpenTelemetry, making it easy to combine SNMP data with other telemetry sources:
# Example OpenTelemetry Collector configuration for collecting SNMP data
receivers:
  snmp:
    collection_interval: 60s
    endpoint: 'udp://192.168.1.1:161'
    version: v2c
    community: 'public'
    metrics:
      if_octets:
        oid: '1.3.6.1.2.1.2.2.1.10.1'
        type: counter
      if_errors:
        oid: '1.3.6.1.2.1.2.2.1.14.1'
        type: counter

exporters:
  otlp:
    endpoint: 'uptrace:4317'

service:
  pipelines:
    metrics:
      receivers: [snmp]
      exporters: [otlp]
With Uptrace, you can transform traditional SNMP monitoring into part of observability strategy, providing deep understanding of your network infrastructure's operation and its impact on overall IT system performance. You can TRY Uptrace for FREE to find out it benefits.
Conclusion
SNMP remains a fundamental technology for monitoring network infrastructure, providing a standardized way to collect data from devices made by various manufacturers. Despite its age, the protocol continues to evolve and adapt to the modern requirements of IT environments.
By understanding the architecture and following best practices for deployment and configuration, teams can leverage the full potential of SNMP to enhance their observability capabilities and gain deeper insights into their network infrastructure.
Whether you're just beginning your network monitoring journey or looking to optimize an existing implementation, SNMP provides a solid foundation for comprehensive network device monitoring.
FAQ
What is the primary advantage of using SNMP monitoring? The primary advantage is its universal compatibility with network devices from different manufacturers, eliminating the need for vendor-specific monitoring solutions.
Which SNMP version should I use? For modern deployments, SNMPv3 is recommended due to its enhanced security features. However, SNMPv2c remains widely used for its combination of functionality and simplicity.
How does SNMP monitoring impact network performance? When properly configured, SNMP's impact is minimal. To optimize performance, adjust polling intervals based on device criticality and use efficient commands like GetBulk to reduce network overhead.
Can SNMP monitor cloud infrastructure? While traditional SNMP was designed for physical devices, many cloud providers offer SNMP compatibility or alternative APIs that can be integrated with SNMP-based monitoring systems.
You may also be interested in: