


![[The AI Show Episode 144]: ChatGPT’s New Memory, Shopify CEO’s Leaked “AI First” Memo, Google Cloud Next Releases, o3 and o4-mini Coming Soon & Llama 4’s Rocky Launch](https://www.marketingaiinstitute.com/hubfs/ep%20144%20cover.png)


![GrandChase tier list of the best characters available [April 2025]](https://media.pocketgamer.com/artwork/na-33057-1637756796/grandchase-ios-android-3rd-anniversary.jpg?#)


.png?width=1920&height=1920&fit=bounds&quality=70&format=jpg&auto=webp#)


![Global security vulnerability database gets 11 more months of funding [u]](https://photos5.appleinsider.com/gallery/63338-131616-62453-129471-61060-125967-51013-100774-49862-97722-Malware-Image-xl-xl-xl-(1)-xl-xl.jpg)


![Apple M4 13-inch iPad Pro On Sale for $200 Off [Deal]](https://www.iclarified.com/images/news/97056/97056/97056-640.jpg)
![Apple Shares New 'Mac Does That' Ads for MacBook Pro [Video]](https://www.iclarified.com/images/news/97055/97055/97055-640.jpg)


Interactive Data Dashboards: Trends and Best Practices
In today's data-driven world, static reports aren't enough. Companies need real-time insights to make informed decisions quickly. That's where interactive data dashboards come in. They turn raw data into dynamic visuals, helping teams analyze trends, spot opportunities, and solve problems faster. But not all dashboards are created equal. Some are more confusing than enlightening. Others overwhelm users with too much information. To create effective dashboards, you need to understand both the latest trends and best practices. Let's dive into what's shaping the future of interactive data dashboards and how to design them for maximum impact. Trends Shaping Interactive Data Dashboards 1. AI-Powered Insights Artificial intelligence (AI) is changing the way we interact with data. Instead of manually analyzing reports, AI-powered dashboards automatically highlight key trends. They can even suggest actions based on the patterns they discover. This saves time and reduces the risk of human error. 2. Customization and Personalization Not all users need the same data. Modern dashboards offer personalized views based on roles, preferences, and previous interactions. Whether you're a CEO, a marketing manager, or a data analyst, the dashboard adapts to show what's most relevant to you. 3. Real-Time Data Streaming Gone are the days of waiting for end-of-day reports. Companies now rely on real-time dashboards that update instantly. This is especially important for industries like finance, e-commerce, and logistics, where a few minutes can make a big difference. 4. Mobile-First Design More and more professionals are accessing dashboards on the go. Mobile-responsive designs make it easier to view and interact with data on smaller screens. Touch controls, simplified layouts, and voice search capabilities are becoming standard. 5. Integration with Multiple Data Sources Dashboards that pull data from multiple sources - CRM systems, social media, IoT devices, etc. - provide a more complete view. Companies no longer rely on isolated data sets. Instead, they combine multiple streams of information for better decision making. 6. Enhanced Data Storytelling Data is only useful when people understand it. Modern dashboards don't just display numbers; they tell a story. Interactive charts, animations, and narrative explanations help users quickly digest information and confidently make data-driven decisions. More in our article: https://instandart.com/blog/bespoke-software-development/interactive-data-dashboards-trends-and-best-practices/
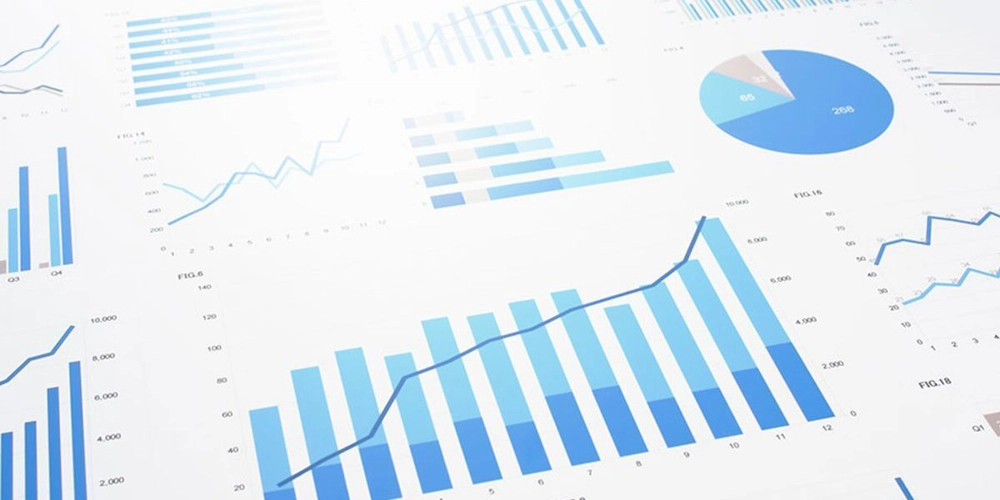
In today's data-driven world, static reports aren't enough. Companies need real-time insights to make informed decisions quickly. That's where interactive data dashboards come in. They turn raw data into dynamic visuals, helping teams analyze trends, spot opportunities, and solve problems faster. But not all dashboards are created equal. Some are more confusing than enlightening. Others overwhelm users with too much information. To create effective dashboards, you need to understand both the latest trends and best practices. Let's dive into what's shaping the future of interactive data dashboards and how to design them for maximum impact.
Trends Shaping Interactive Data Dashboards
1. AI-Powered Insights
Artificial intelligence (AI) is changing the way we interact with data. Instead of manually analyzing reports, AI-powered dashboards automatically highlight key trends. They can even suggest actions based on the patterns they discover. This saves time and reduces the risk of human error.
2. Customization and Personalization
Not all users need the same data. Modern dashboards offer personalized views based on roles, preferences, and previous interactions. Whether you're a CEO, a marketing manager, or a data analyst, the dashboard adapts to show what's most relevant to you.
3. Real-Time Data Streaming
Gone are the days of waiting for end-of-day reports. Companies now rely on real-time dashboards that update instantly. This is especially important for industries like finance, e-commerce, and logistics, where a few minutes can make a big difference.
4. Mobile-First Design
More and more professionals are accessing dashboards on the go. Mobile-responsive designs make it easier to view and interact with data on smaller screens. Touch controls, simplified layouts, and voice search capabilities are becoming standard.
5. Integration with Multiple Data Sources
Dashboards that pull data from multiple sources - CRM systems, social media, IoT devices, etc. - provide a more complete view. Companies no longer rely on isolated data sets. Instead, they combine multiple streams of information for better decision making.
6. Enhanced Data Storytelling
Data is only useful when people understand it. Modern dashboards don't just display numbers; they tell a story. Interactive charts, animations, and narrative explanations help users quickly digest information and confidently make data-driven decisions.
More in our article: https://instandart.com/blog/bespoke-software-development/interactive-data-dashboards-trends-and-best-practices/