


![[The AI Show Episode 144]: ChatGPT’s New Memory, Shopify CEO’s Leaked “AI First” Memo, Google Cloud Next Releases, o3 and o4-mini Coming Soon & Llama 4’s Rocky Launch](https://www.marketingaiinstitute.com/hubfs/ep%20144%20cover.png)


![Blue Archive tier list [April 2025]](https://media.pocketgamer.com/artwork/na-33404-1636469504/blue-archive-screenshot-2.jpg?#)


.png?#)


-Baldur’s-Gate-3-The-Final-Patch---An-Animated-Short-00-03-43.png?width=1920&height=1920&fit=bounds&quality=70&format=jpg&auto=webp#)


![Nanoleaf Announces New Pegboard Desk Dock With Dual-Sided Lighting [Video]](https://www.iclarified.com/images/news/97030/97030/97030-640.jpg)

![Apple's Foldable iPhone May Cost Between $2100 and $2300 [Rumor]](https://www.iclarified.com/images/news/97028/97028/97028-640.jpg)
![Apple Releases Public Betas of iOS 18.5, iPadOS 18.5, macOS Sequoia 15.5 [Download]](https://www.iclarified.com/images/news/97024/97024/97024-640.jpg)


How to Use AI to Quickly Analyze CSV Data & Get Insights
Comma Separated Value (CSV) files are common types of data files that are used in data analysis to help organize and structure data for storage. If you’re someone who works with financial records, customer information or even machine learning datasets, CSV files are a go to format because of their simplicity and the fact that they can be imported into almost any tool including Microsoft Excel, Google Sheets and even Python. But, CSV files can be challenging mainly when working with large datasets. Traditional approaches to dealing with CSV files include direct manipulation of the spreadsheets or using Python and Pandas library. All these methods are not without their challenges and can be quite time consuming. Standard activities like data cleaning, data sorting and creating visualizations are often manual and boring processes that are prone to errors. This is where the new generation of AI powered tools like Quadratic AI are changing the way we analyze CSV files. By leveraging artificial intelligence, Quadratic makes data cleaning, summarization and visualization easy without the need to write formulas or code. For anyone who is a data analyst, business person or researcher, Quadratic simplifies work processes to help more people work with heavy data processing. With the help of Quadratic, users can easily clean, filter, summarize and visualize data in the manner of their choice, whether they prefer a no-code, low-code or code-driven approach. Why CSV Files Matter in Data Analysis CSV files are a staple in various industries like finance, marketing, healthcare and even in machine learning. Their simplicity, compatibility, and efficiency make them a go-to option for storing and sharing data. Universal Compatibility CSV files can be used everywhere and with almost any tool. Numerous tools, such as spreadsheet programs like Microsoft Excel, Google Sheets, and LibreOffice. Python with Pandas integrated and AI-powered spreadsheet platforms like Quadratic, which blend the flexibility of spreadsheets with AI-powered features, can open and process CSV files. How Quadratic Enhances Compatibility: Quadratic supports CSV files without lagging. Quadratic gives users flexibility. Both Python scripting and spreadsheet-like interactivity are available to users. Lightweight & Efficient CSV files are a good, efficient way of storing structured data due to compact and less complex structure and requiring less space to store. There is no need for a lot of memory to load and analyze a CSV file. How Quadratic Enhances Efficiency of CSV files: Quadratic handles datasets in CSV formats effortlessly. It is easy to load CSV files on Quadratic without any lagging. Structured & Flexible CSV files have a structured format that allows data manipulation. In a CSV file, each row denotes a record, and each column denotes a field, which facilitates data analysis and transformation. How Quadratic Enhances Structure & Flexibility: Quadratic can provide AI-driven suggestions for handling missing values, inconsistent formats and duplicate records. Quadratic can easily answer questions regarding data since it comprehends natural language queries. Traditional Methods for Analyzing CSV Data Spreadsheet software like Google Sheets and Excel have been the common tools for working on CSV files for a long time. These tools are widely utilized across industries because they offer well-known features like sorting, filtering and formulas. However, traditional methods can become time-consuming and limited in their capabilities as datasets get larger and analyses get complex. Quadratic AI improves these traditional spreadsheet features and makes data analysis more flexible, automated and scalable by integrating Python scripting into a grid-based interface. Sorting, Filtering and Conditional Formatting Traditional spreadsheet tools make organization of csv files easy by allowing users to sort and filter data using built-in dropdowns. However, complex logic requires nested formulas, and filtering options are frequently restricted to basic conditions. While advanced formatting may require manual setup or solutions, conditional formatting in traditional spreadsheets uses color-based rules to highlight data patterns. Quadratic AI enhances these features while offering spreadsheet familiarity such as interactive sorting and filtering and also adding Python scripting for greater flexibility. Beyond standard formulas, users can automate transformations and define custom filtering rules. Python logic can also be used with conditional formatting to enable dynamic changes based on advanced criteria, improving the efficiency of large-scale data handling. Using Formulas in Quadratic Calculations in traditional spreadsheets are done using built-in functions like SUM(), VLOOKUP(), and IF(). While these functions are helpful, they become limited when working with large
Comma Separated Value (CSV) files are common types of data files that are used in data analysis to help organize and structure data for storage. If you’re someone who works with financial records, customer information or even machine learning datasets, CSV files are a go to format because of their simplicity and the fact that they can be imported into almost any tool including Microsoft Excel, Google Sheets and even Python.
But, CSV files can be challenging mainly when working with large datasets. Traditional approaches to dealing with CSV files include direct manipulation of the spreadsheets or using Python and Pandas library. All these methods are not without their challenges and can be quite time consuming. Standard activities like data cleaning, data sorting and creating visualizations are often manual and boring processes that are prone to errors.
This is where the new generation of AI powered tools like Quadratic AI are changing the way we analyze CSV files. By leveraging artificial intelligence, Quadratic makes data cleaning, summarization and visualization easy without the need to write formulas or code. For anyone who is a data analyst, business person or researcher, Quadratic simplifies work processes to help more people work with heavy data processing. With the help of Quadratic, users can easily clean, filter, summarize and visualize data in the manner of their choice, whether they prefer a no-code, low-code or code-driven approach.
Why CSV Files Matter in Data Analysis
CSV files are a staple in various industries like finance, marketing, healthcare and even in machine learning. Their simplicity, compatibility, and efficiency make them a go-to option for storing and sharing data.
Universal Compatibility
CSV files can be used everywhere and with almost any tool. Numerous tools, such as spreadsheet programs like Microsoft Excel, Google Sheets, and LibreOffice. Python with Pandas integrated and AI-powered spreadsheet platforms like Quadratic, which blend the flexibility of spreadsheets with AI-powered features, can open and process CSV files.
How Quadratic Enhances Compatibility:
Quadratic supports CSV files without lagging.
Quadratic gives users flexibility. Both Python scripting and spreadsheet-like interactivity are available to users.
Lightweight & Efficient
CSV files are a good, efficient way of storing structured data due to compact and less complex structure and requiring less space to store. There is no need for a lot of memory to load and analyze a CSV file.
How Quadratic Enhances Efficiency of CSV files:
Quadratic handles datasets in CSV formats effortlessly.
It is easy to load CSV files on Quadratic without any lagging.
Structured & Flexible
CSV files have a structured format that allows data manipulation. In a CSV file, each row denotes a record, and each column denotes a field, which facilitates data analysis and transformation.
How Quadratic Enhances Structure & Flexibility:
Quadratic can provide AI-driven suggestions for handling missing values, inconsistent formats and duplicate records.
Quadratic can easily answer questions regarding data since it comprehends natural language queries.
Traditional Methods for Analyzing CSV Data
Spreadsheet software like Google Sheets and Excel have been the common tools for working on CSV files for a long time. These tools are widely utilized across industries because they offer well-known features like sorting, filtering and formulas. However, traditional methods can become time-consuming and limited in their capabilities as datasets get larger and analyses get complex.
Quadratic AI improves these traditional spreadsheet features and makes data analysis more flexible, automated and scalable by integrating Python scripting into a grid-based interface.
Sorting, Filtering and Conditional Formatting
Traditional spreadsheet tools make organization of csv files easy by allowing users to sort and filter data using built-in dropdowns. However, complex logic requires nested formulas, and filtering options are frequently restricted to basic conditions. While advanced formatting may require manual setup or solutions, conditional formatting in traditional spreadsheets uses color-based rules to highlight data patterns.
Quadratic AI enhances these features while offering spreadsheet familiarity such as interactive sorting and filtering and also adding Python scripting for greater flexibility. Beyond standard formulas, users can automate transformations and define custom filtering rules. Python logic can also be used with conditional formatting to enable dynamic changes based on advanced criteria, improving the efficiency of large-scale data handling.
Using Formulas in Quadratic
Calculations in traditional spreadsheets are done using built-in functions like SUM(), VLOOKUP(), and IF(). While these functions are helpful, they become limited when working with large datasets or carrying out complex and iterative calculations. When attempting to apply advanced logic across datasets, users often run into performance problems and have to devise workarounds.
Quadratic AI improves formula-based computation by supporting both standard spreadsheet functions and Python scripting. This hybrid approach allows users to perform advanced data manipulations like statistical modeling, dynamic string transformations, and even machine learning predictions all within the same interface. Formulas powered by Python offer more flexibility, allowing real-time automation and scalability beyond the limitations of traditional spreadsheets.
Implementing Pivot Table-Like Summarization
Pivot tables are used in traditional spreadsheets to quickly summarize and visualize large datasets. Although they work well, pivot tables are inflexible and frequently need to be updated by hand whenever new data is added. They also provides little flexibility in terms of real-time filtering and custom computations.
Quadratic AI uses Python's Pandas groupby() function to make up for the lack of built-in pivot tables. This enables users to apply custom aggregations, generate dynamic summaries, and automate updates without the need for human intervention. Pandas-powered summarization in Quadratic AI is more adaptable and scalable than traditional pivot tables because it can manage complex data transformations.
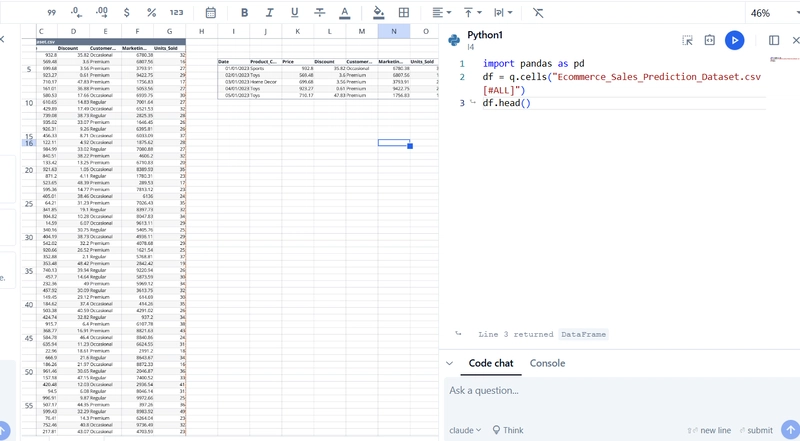
Using Python for CSV Analysis Inside Quadratic
One of the key advantages of Quadratic AI is its integrated Python support, which enables smooth script execution in the spreadsheet environment.
Loading and Manipulating CSV Files with Pandas
Quadratic supports direct file imports, enabling users to load CSV files and manipulate data using Pandas. Within Python cells in Quadratic interface, tasks like handling missing values, renaming columns, and filtering data can be completed. This ensures efficient pre-processing of data within the Quadratic environment.
Data Transformations and Aggregations.
Quadratic AI allows users to perform effective data transformations, including Data exploration, visualizations, applying aggregations and carrying out other Python-based operations.
These operations allows users to analyze and manipulate data without needing to export data to an external Python environment.
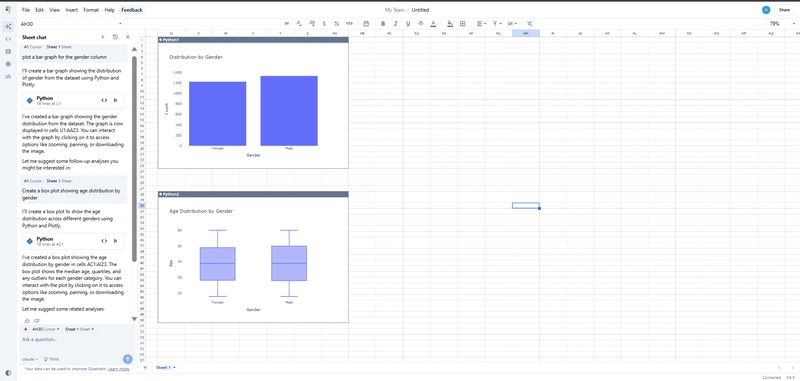
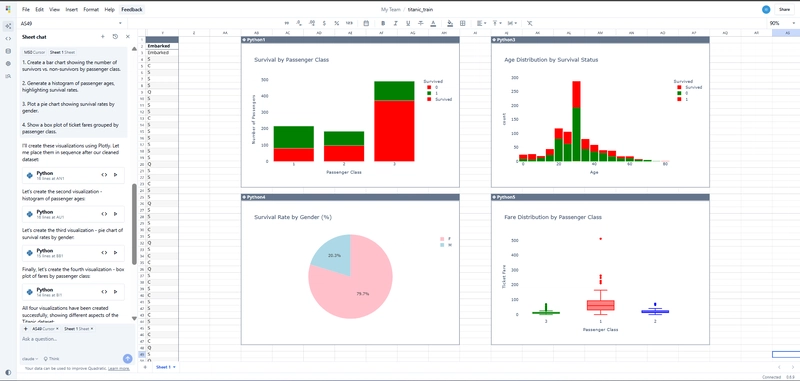
Generating Visualizations
Quadratic exclusively supports Plotly for data visualization, allowing users to create bar charts, line graphs, scatter plots, and histograms directly within the spreadsheet environment and displayed directly in the spreadsheet. Users can easily explore and visualize data with interactive features such as zooming, and resizing charts.
Plotly's customizing choices further allows users to change axis labels, color schemes, and chart layouts, so improving the whole presentation of data insights. Plotly's features within Quadratic allows users create interactive and educational visuals without external tools.
Quadratic gives benefits of unified environment by combining spreadsheet usability with the computational power of python and also reduction of repetitive tasks through script automation.
AI-Powered CSV Analysis with Quadratic
Quadratic AI enhances traditional data analysis by integrating artificial intelligence to automate tedious processes, enhance data quality, and produce insights with little manual effort. These AI-powered features simplify CSV analysis, increasing the effectiveness of data exploration and visualization.
Quadratic provides users the ability to manage big datasets with ease by combining the flexibility of spreadsheets with AI driven automation.
Users can use Quadratic AI to find patterns and streamline processes rather than depending on labor-intensive scripting, formula-based computations, and manual filtering. Quadratic's AI capabilities greatly reduce the time and effort needed for in-depth analysis, whether it's cleaning up messy data, summarizing important trends, or generating insightful visualizations.
Additionally, by providing guided automation for routine analytical tasks, and natural language processing for data querying, Quadratic AI helps to bridge the gap between technical and non-technical users. These features guarantee that insights can be obtained effectively without the need for deep coding knowledge, making it accessible to engineers, data scientists and business analysts.
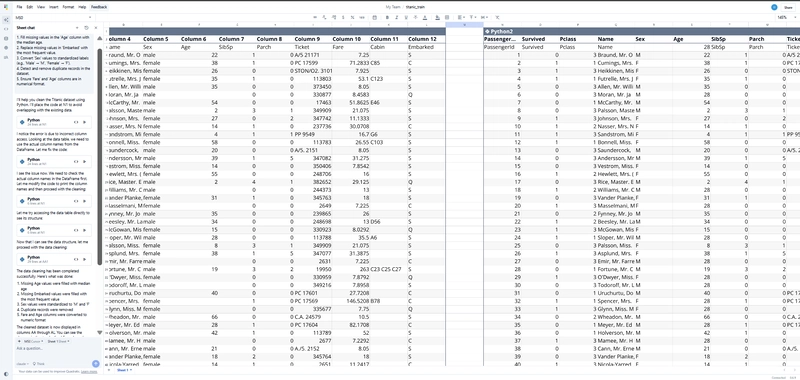
Automating Data Cleaning
One of the most time-consuming parts of analysis is frequently cleaning and preparing the data. Quadratic AI introduces automation to speed up this procedure while maintaining accuracy.
User-Guided Duplicate Detection and Removal
Quadratic can automatically find and remove duplicate rows in a dataset using predefined algorithms and user-specified instructions. Users can also instruct Quadratic to handle duplicates ensuring precise and customized data cleaning.
User-Guided Handling of Missing Data
Quadratic allows users to handle missing data by specifying rules through Python.
users can decide how to replace, eliminate, or impute missing values depending on their analysis requirements.
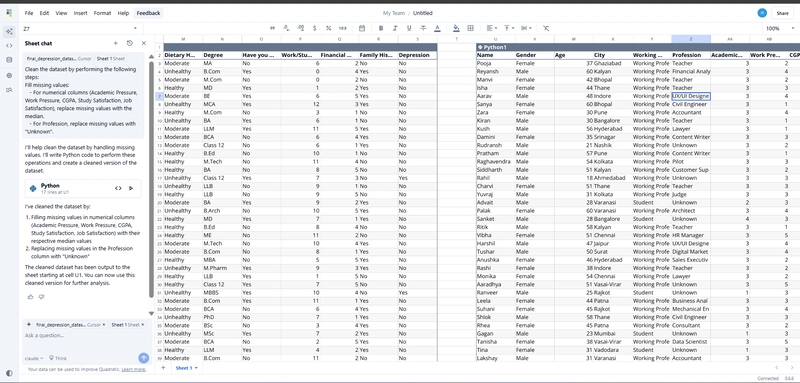
User-Defined Detection and Correction of Inconsistent Data Formats
Quadratic uses Python scripting to help users find and fix inconsistent data formats. Users can effectively standardize datasets by using functions like str.replace() for string corrections and astype() for data type conversions.
AI-Assisted Data Filtering and Summarization
Quadratic makes it simpler to extract insights without writing complicated scripts by enabling users to filter data using natural language queries.
Quadratic has ability to understand natural language queries, making it easy for users to ask questions about data.
Instead of manually applying filters, users can just type a natural language query. For example:
"Show all transactions above $500 in the last quarter."
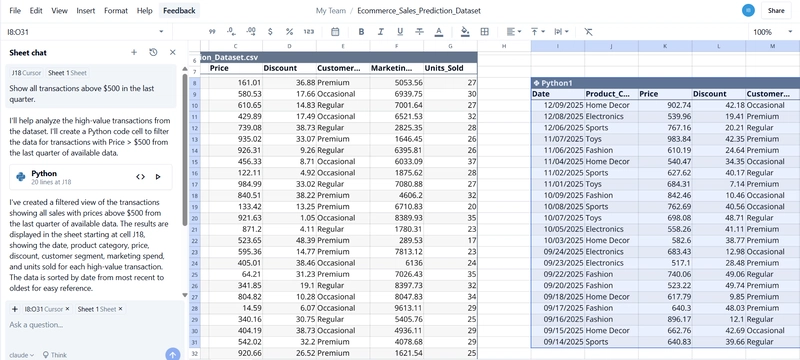
Users can also create summary tables based on user-defined parameters and dataset structure thanks to AI-powered summarization features.
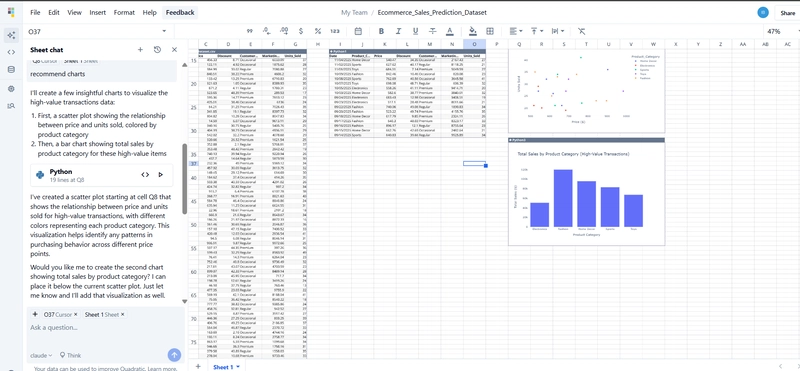
Visualizing CSV Data with AI
Quadratic guides users to efficient chart representations by recommending visualization types based on dataset structure.
For better data presentation, users can easily customize suggested charts by modifying components like labels, colors and axes.
Step-by-Step Guide: Analyzing a CSV File with Quadratic
- Import Data: Import the CSV file from connected databases or local storage.
- Clean and prepare data: Define rules to Automate data cleaning and gain insights using natural language query.
- Visualize Data: Use Quadratic's AI-assisted visualization recommendations to create charts and reports.
Transform Data: Utilize Python functions for summarization, filtering, and aggregation to transform and analyze data.
Export and Share: Store the cleaned and analysed data for use in reports, collaborative projects or further analysis.
Key Takeaways
Analyzing data using a traditional spreadsheet can be tedious, repetitive and time-consuming. Quadratic AI optimizes CSV analysis by combining Python with spreadsheet capabilities, giving customers the flexibility to specify how duplicates, missing values, and inconsistencies are handled.
Quadratic enhances data exploration With Python-based filtering and natural language queries, while recommending visualizations according to dataset structure.
With Quadratic, users can define how missing values, duplicates and inconsistent formats are handled. The built-in Python support makes advanced transformations and analysis possible and the process is made more effective and smooth by its optimized architecture, which can handle large datasets without lagging.
Conclusion
Analyzing data shouldn't be complex. Traditional approaches, whether coding or spreadsheets, require time-consuming data wrangling, complex formulas and manual setup, which slows down productivity and delays insights. Quadratic enhances CSV analysis with user-defined instructions for data cleaning, filtering, and visualization.
Without writing formulas or scripts, users can extract valuable insights with natural language queries, AI-assisted insights, and instant chart generation. Quadratic provides a quicker, more intelligent, and more effective method of analyzing CSV files for business analysts, data scientists and other professionals working with structured datasets. This improves workflow efficiency, productivity, and decision-making.
Experience the future of intelligent and automated data analysis by giving Quadratic a try today.
Quadratic offers greater flexibility in data analysis, by combining the best features of spreadsheets and programming.
If you found this article useful, share it with your peers and community.
If You ❤️ My Content! Connect Me on Twitter
Check SaaS Tools I Use