


![[The AI Show Episode 142]: ChatGPT’s New Image Generator, Studio Ghibli Craze and Backlash, Gemini 2.5, OpenAI Academy, 4o Updates, Vibe Marketing & xAI Acquires X](https://www.marketingaiinstitute.com/hubfs/ep%20142%20cover.png)


![From drop-out to software architect with Jason Lengstorf [Podcast #167]](https://cdn.hashnode.com/res/hashnode/image/upload/v1743796461357/f3d19cd7-e6f5-4d7c-8bfc-eb974bc8da68.png?#)


.png?#)


_Christophe_Coat_Alamy.jpg?#)
 (1).webp?#)


![Apple Considers Delaying Smart Home Hub Until 2026 [Gurman]](https://www.iclarified.com/images/news/96946/96946/96946-640.jpg)
![iPhone 17 Pro Won't Feature Two-Toned Back [Gurman]](https://www.iclarified.com/images/news/96944/96944/96944-640.jpg)
![Tariffs Threaten Apple's $999 iPhone Price Point in the U.S. [Gurman]](https://www.iclarified.com/images/news/96943/96943/96943-640.jpg)


鸿蒙Next开发教程--在鸿蒙中开发图表(ECharts)
今天要分享的教程是如何在鸿蒙开发中使用图表,说到图表不得不提ECharts,它依旧是目前为止功能最丰富、兼容性最高的图表库。所以我依然选择使用ECharts。 在其他平台使用过ECharts的友友都知道,ECharts的使用流程是先使用html引入ECharts库,然后在界面中使用webview将html加载出来,最后将图表数据注入就可以了。在鸿蒙中依然不例外。 ECharts库可以到官网定制下载,下载后使用html引入图表: const container = document.getElementById('chart') function init(width, height) { container.style.width = width; container.style.height = height; window.myChart = window.echarts.init(container); window.myChart.on('click', function(params) { window.ohosCallNative.callNative('click', { componentType: params.componentType, seriesType: params.seriesType, seriesIndex: params.seriesIndex, seriesName: params.seriesName, name: params.name, dataIndex: params.dataIndex, dataType: params.dataType, value: params.value, color: params.color, }); }); } 然后在ArkTS中加载html: Web({ src: $rawfile('echarts.html'), controller: this.controller }) .width('100%') .height('100%') .javaScriptAccess(true) .backgroundColor(this.webBackgroundColor) .onPageBegin(() => { }) .onPageEnd(e => { this.init(this.canvasWidth, this.canvasHeight); this.setOption(this.option); if (this.onLoaded) { this.onLoaded(this); } }) 关于向图表中注入数据,我们使用Web组件的runJavaScript方法来实现: option: EChartsOption = { title: { text: 'ECharts 入门示例' }, tooltip: {}, legend: { data: ['销量'] }, xAxis: { data: ['衬衫', '羊毛衫', '雪纺衫', '裤子', '高跟鞋', '袜子'] }, yAxis: {}, series: [ { name: '销量', type: 'bar', data: [5, 20, 36, 10, 10, 20] } ] }; this.controller.runJavaScript(`myChart.setOption(${JSON.stringify(option)})`);
今天要分享的教程是如何在鸿蒙开发中使用图表,说到图表不得不提ECharts,它依旧是目前为止功能最丰富、兼容性最高的图表库。所以我依然选择使用ECharts。
在其他平台使用过ECharts的友友都知道,ECharts的使用流程是先使用html引入ECharts库,然后在界面中使用webview将html加载出来,最后将图表数据注入就可以了。在鸿蒙中依然不例外。
ECharts库可以到官网定制下载,下载后使用html引入图表:
然后在ArkTS中加载html:
Web({ src: $rawfile('echarts.html'), controller: this.controller })
      .width('100%')
      .height('100%')
      .javaScriptAccess(true)
      .backgroundColor(this.webBackgroundColor)
      .onPageBegin(() => {

      })
      .onPageEnd(e => {
        this.init(this.canvasWidth, this.canvasHeight);
        this.setOption(this.option);
        if (this.onLoaded) {
          this.onLoaded(this);
        }
      })
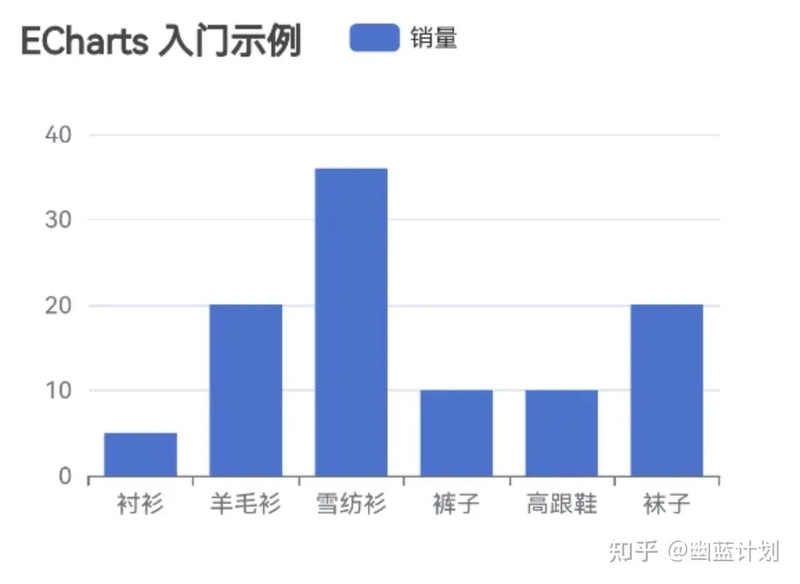
关于向图表中注入数据,我们使用Web组件的runJavaScript方法来实现:
option: EChartsOption = {
    title: {
      text: 'ECharts 入门示例'
    },
    tooltip: {},
    legend: {
      data: ['销量']
    },
    xAxis: {
      data: ['衬衫', '羊毛衫', '雪纺衫', '裤子', '高跟鞋', '袜子']
    },
    yAxis: {},
    series: [
      {
        name: '销量',
        type: 'bar',
        data: [5, 20, 36, 10, 10, 20]
      }
    ]
  };


this.controller.runJavaScript(`myChart.setOption(${JSON.stringify(option)})`);