TracePerf: A TypeScript-Powered Logging and Performance Tracking Library for Modern JavaScript Applications
Introduction As JavaScript applications grow in complexity, debugging and performance optimization become increasingly challenging. Traditional logging tools often fall short when it comes to visualizing execution flow, identifying bottlenecks, and adapting to different environments. After struggling with these limitations in production applications, I decided to build TracePerf, a TypeScript-powered logging and performance tracking library designed to solve real-world problems faced by JavaScript developers. The Problem with Traditional Logging Most JavaScript developers are familiar with the standard approach to debugging: console.log('Starting function'); // ... code ... console.log('Result:', result); console.log('Function completed'); While this works for simple cases, it quickly becomes unwieldy as applications grow: Execution Flow Blindness: It's difficult to visualize how functions call each other Performance Black Holes: Identifying slow functions requires manual instrumentation Environment Switching: Different logging needs for development vs. production Debugging Residue: Debug logs must be manually removed for production Browser/Node.js Fragmentation: Different logging approaches for frontend and backend Introducing TracePerf TracePerf is designed to address these challenges with a unified, powerful approach to logging and performance tracking. Built with TypeScript from the ground up, it provides excellent type safety while maintaining a simple, intuitive API. Key Features 1. Visual Execution Flow Tracking TracePerf automatically generates ASCII flowcharts that visualize how functions call each other: Execution Flow: ┌──────────────────────────────┐ │ fetchData │ ⏱ 5ms └──────────────────────────────┘ │ ▼ ┌──────────────────────────────┐ │ processData │ ⏱ 3ms └──────────────────────────────┘ │ ▼ ┌──────────────────────────────┐ │ calculateResults │ ⏱ 150ms ⚠️ SLOW └──────────────────────────────┘ This visual representation makes it immediately clear how functions interact and where time is being spent. 2. Automatic Bottleneck Detection TracePerf automatically flags slow functions, making performance bottlenecks immediately visible: function calculateResults() { // Expensive operation for (let i = 0; i { return processData(['a', 'b', 'c']); }, options); Real-World Examples Node.js API Performance Tracking const tracePerf = require('traceperf'); const express = require('express'); const app = express(); app.get('/users', (req, res) => { tracePerf.track(() => { // Track the entire request handling const users = fetchUsersFromDatabase(); const processedUsers = processUserData(users); res.json(processedUsers); }, { label: 'GET /users' }); }); function fetchUsersFromDatabase() { return tracePerf.track(() => { // Database query simulation return [{ id: 1, name: 'John' }, { id: 2, name: 'Jane' }]; }, { label: 'fetchUsersFromDatabase' }); } function processUserData(users) { return tracePerf.track(() => { // Data processing simulation return users.map(user => ({ ...user, displayName: user.name.toUpperCase() })); }, { label: 'processUserData' }); } This will generate a detailed execution flow chart showing exactly how long each part of the request handling takes, making it easy to identify bottlenecks. React Component Performance Optimization import React, { useEffect, useState } from 'react'; import tracePerf from 'traceperf/browser'; function DataGrid({ data }) { const [processedData, setProcessedData] = useState([]); useEffect(() => { tracePerf.group('DataGrid Processing'); tracePerf.track(() => { // Expensive data transformation const result = data.map(item => transformItem(item)); setProcessedData(result); }, { label: 'dataTransformation', threshold: 50 }); tracePerf.groupEnd(); // Cleanup function return () => { tracePerf.debug('Component unmounting'); }; }, [data]); function transformItem(item) { return tracePerf.track(() => { // Item-level transformation return { ...item, processed: true }; }, { label: 'transformItem' }); } return ( {processedData.map(item => ( {item.name} ))} ); } This example shows how TracePerf can be used to track performance in React components, helping identify rendering bottlenecks and optimize user experience. Advanced Features Custom Logger Configuration TracePerf allows you to create custom logger instances with specific configurations: const { createLogger } = require('traceperf'); const logger = createLogger({ mode: 'dev', level: 'debug', colorize: true, timestamp: t
Introduction
As JavaScript applications grow in complexity, debugging and performance optimization become increasingly challenging. Traditional logging tools often fall short when it comes to visualizing execution flow, identifying bottlenecks, and adapting to different environments.
After struggling with these limitations in production applications, I decided to build TracePerf, a TypeScript-powered logging and performance tracking library designed to solve real-world problems faced by JavaScript developers.
The Problem with Traditional Logging
Most JavaScript developers are familiar with the standard approach to debugging:
console.log('Starting function');
// ... code ...
console.log('Result:', result);
console.log('Function completed');
While this works for simple cases, it quickly becomes unwieldy as applications grow:
- Execution Flow Blindness: It's difficult to visualize how functions call each other
- Performance Black Holes: Identifying slow functions requires manual instrumentation
- Environment Switching: Different logging needs for development vs. production
- Debugging Residue: Debug logs must be manually removed for production
- Browser/Node.js Fragmentation: Different logging approaches for frontend and backend
Introducing TracePerf
TracePerf is designed to address these challenges with a unified, powerful approach to logging and performance tracking. Built with TypeScript from the ground up, it provides excellent type safety while maintaining a simple, intuitive API.
Key Features
1. Visual Execution Flow Tracking
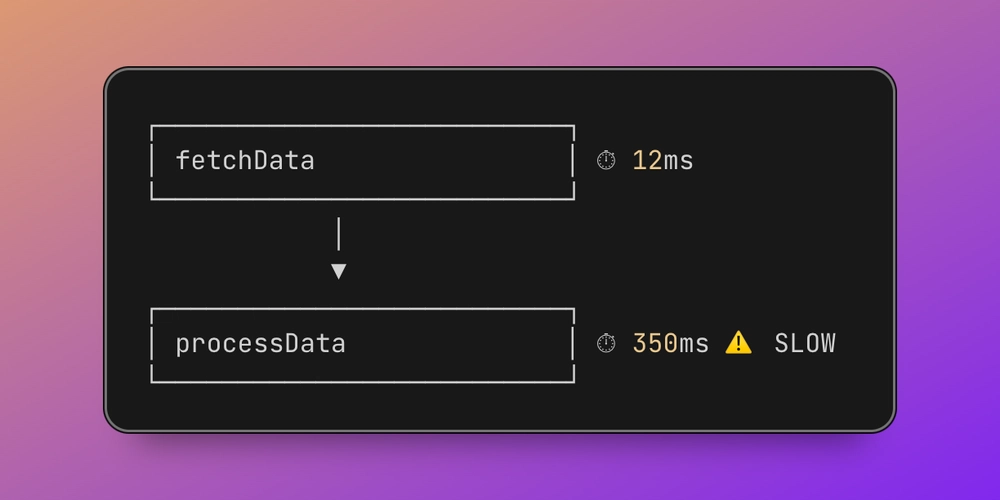
TracePerf automatically generates ASCII flowcharts that visualize how functions call each other:
Execution Flow:
┌──────────────────────────────┐
│         fetchData            │  ⏱  5ms
└──────────────────────────────┘
                │
                ▼
┌──────────────────────────────┐
│        processData           │  ⏱  3ms
└──────────────────────────────┘
                │
                ▼
┌──────────────────────────────┐
│      calculateResults        │  ⏱  150ms ⚠️ SLOW
└──────────────────────────────┘
This visual representation makes it immediately clear how functions interact and where time is being spent.
2. Automatic Bottleneck Detection
TracePerf automatically flags slow functions, making performance bottlenecks immediately visible:
function calculateResults() {
  // Expensive operation
  for (let i = 0; i < 1000000; i++) {}
  return 'done';
}

// TracePerf will automatically flag this as slow if it exceeds the threshold
tracePerf.track(calculateResults);
3. Environment-Aware Logging
TracePerf adapts its behavior based on the environment:
// Development mode (default)
tracePerf.setMode('dev');
tracePerf.debug('Debug info'); // Shown

// Production mode
tracePerf.setMode('prod');
tracePerf.debug('Debug info'); // Not shown
tracePerf.error('Critical error'); // Shown
4. Universal JavaScript Support
The same API works across Node.js and browser environments:
// Node.js
const tracePerf = require('traceperf');

// Browser/React/Next.js
import tracePerf from 'traceperf/browser';
5. First-Class TypeScript Support
As a TypeScript-first library, TracePerf provides excellent type safety and IntelliSense support:
import tracePerf from 'traceperf';
import { ITrackOptions } from 'traceperf/types';

// Type-safe options
const options: ITrackOptions = {
  label: 'dataProcessing',
  threshold: 50,
  silent: false
};

// Type-safe function tracking
tracePerf.track<string[]>(() => {
  return processData(['a', 'b', 'c']);
}, options);
Real-World Examples
Node.js API Performance Tracking
const tracePerf = require('traceperf');
const express = require('express');
const app = express();

app.get('/users', (req, res) => {
  tracePerf.track(() => {
    // Track the entire request handling
    const users = fetchUsersFromDatabase();
    const processedUsers = processUserData(users);
    res.json(processedUsers);
  }, { label: 'GET /users' });
});

function fetchUsersFromDatabase() {
  return tracePerf.track(() => {
    // Database query simulation
    return [{ id: 1, name: 'John' }, { id: 2, name: 'Jane' }];
  }, { label: 'fetchUsersFromDatabase' });
}

function processUserData(users) {
  return tracePerf.track(() => {
    // Data processing simulation
    return users.map(user => ({
      ...user,
      displayName: user.name.toUpperCase()
    }));
  }, { label: 'processUserData' });
}
This will generate a detailed execution flow chart showing exactly how long each part of the request handling takes, making it easy to identify bottlenecks.
React Component Performance Optimization
import React, { useEffect, useState } from 'react';
import tracePerf from 'traceperf/browser';

function DataGrid({ data }) {
  const [processedData, setProcessedData] = useState([]);

  useEffect(() => {
    tracePerf.group('DataGrid Processing');

    tracePerf.track(() => {
      // Expensive data transformation
      const result = data.map(item => transformItem(item));
      setProcessedData(result);
    }, { label: 'dataTransformation', threshold: 50 });

    tracePerf.groupEnd();

    // Cleanup function
    return () => {
      tracePerf.debug('Component unmounting');
    };
  }, [data]);

  function transformItem(item) {
    return tracePerf.track(() => {
      // Item-level transformation
      return { ...item, processed: true };
    }, { label: 'transformItem' });
  }

  return (
    <div className="data-grid">
      {processedData.map(item => (
        <div key={item.id}>{item.name}div>
      ))}
    div>
  );
}
This example shows how TracePerf can be used to track performance in React components, helping identify rendering bottlenecks and optimize user experience.
Advanced Features
Custom Logger Configuration
TracePerf allows you to create custom logger instances with specific configurations:
const { createLogger } = require('traceperf');

const logger = createLogger({
  mode: 'dev',
  level: 'debug',
  colorize: true,
  timestamp: true,
  performanceThreshold: 100, // ms
  indentSize: 2,
});
Nested Logging with Groups
Organize related logs with logical grouping:
tracePerf.group('User Authentication');
tracePerf.info('Checking credentials');
tracePerf.warn('Invalid password attempt');
tracePerf.groupEnd();
Memory Usage Tracking
Monitor memory consumption alongside execution time:
const memoryUsage = tracePerf.getMemoryUsage();
console.log(`Heap used: ${memoryUsage.heapUsed} bytes`);
Implementation Details
TracePerf is built with a modular architecture that separates concerns:
- Core Logging: Handles basic logging functionality
- Performance Monitoring: Tracks execution time and memory usage
- Execution Tracking: Builds the execution flow visualization
- Formatters: Transforms log data into different output formats
This architecture makes TracePerf both powerful and extensible, allowing for future enhancements without breaking changes.
Browser Compatibility
TracePerf's browser version is designed to work in all modern browsers, with special attention to performance impact. The library is lightweight and avoids unnecessary operations that could affect your application's performance.
Module System Compatibility
TracePerf supports both CommonJS and ESM (ECMAScript Modules), making it compatible with virtually any JavaScript project:
// CommonJS
const tracePerf = require('traceperf');

// ESM
import tracePerf from 'traceperf';
Future Roadmap
TracePerf is actively being developed, with several exciting features on the horizon:
- Additional Output Formats: JSON, CSV, and custom formatters
- Persistent Logging: File-based logging for long-term analysis
- Remote Logging Integration: Send logs to centralized services
- Performance Comparison Reports: Compare performance across different versions
- Enhanced TypeScript Types: More comprehensive type definitions
- Visual Studio Code Extension: Direct IDE integration
Getting Started
Installing TracePerf is straightforward:
npm install traceperf
Or with Yarn:
yarn add traceperf
Conclusion
TracePerf represents a new approach to logging and performance tracking in JavaScript applications. By combining visual execution flow tracking, automatic bottleneck detection, and environment-aware logging in a TypeScript-first package, it addresses many of the pain points developers face when debugging and optimizing their applications.
Whether you're building a Node.js backend, a React frontend, or a full-stack JavaScript application, TracePerf provides the tools you need to understand what's happening in your code and identify opportunities for improvement.
I'd love to hear your feedback and feature requests! What logging and debugging challenges do you face that TracePerf could help solve?
Resources
Shubh Wadekar is a JavaScript developer focused on building high-performance applications. Follow me for more articles on JavaScript development, performance optimization, and developer tools.






![[The AI Show Episode 142]: ChatGPT’s New Image Generator, Studio Ghibli Craze and Backlash, Gemini 2.5, OpenAI Academy, 4o Updates, Vibe Marketing & xAI Acquires X](https://www.marketingaiinstitute.com/hubfs/ep%20142%20cover.png)


















![[DEALS] The Premium Learn to Code Certification Bundle (97% off) & Other Deals Up To 98% Off – Offers End Soon!](https://www.javacodegeeks.com/wp-content/uploads/2012/12/jcg-logo.jpg)


![From drop-out to software architect with Jason Lengstorf [Podcast #167]](https://cdn.hashnode.com/res/hashnode/image/upload/v1743796461357/f3d19cd7-e6f5-4d7c-8bfc-eb974bc8da68.png?#)












.png?#)




_Christophe_Coat_Alamy.jpg?#)
 (1).webp?#)


![Apple Considers Delaying Smart Home Hub Until 2026 [Gurman]](https://www.iclarified.com/images/news/96946/96946/96946-640.jpg)
![iPhone 17 Pro Won't Feature Two-Toned Back [Gurman]](https://www.iclarified.com/images/news/96944/96944/96944-640.jpg)
![Tariffs Threaten Apple's $999 iPhone Price Point in the U.S. [Gurman]](https://www.iclarified.com/images/news/96943/96943/96943-640.jpg)


