


![[The AI Show Episode 144]: ChatGPT’s New Memory, Shopify CEO’s Leaked “AI First” Memo, Google Cloud Next Releases, o3 and o4-mini Coming Soon & Llama 4’s Rocky Launch](https://www.marketingaiinstitute.com/hubfs/ep%20144%20cover.png)


![Is there a windows-based CIDR list sorter / condenser - aggregator? [closed]](https://cdn.sstatic.net/Sites/softwareengineering/Img/apple-touch-icon@2.png?v=1ef7363febba)


_Andreas_Prott_Alamy.jpg?width=1280&auto=webp&quality=80&disable=upscale#)


![What features do you get with Gemini Advanced? [April 2025]](https://i0.wp.com/9to5google.com/wp-content/uploads/sites/4/2024/02/gemini-advanced-cover.jpg?resize=1200%2C628&quality=82&strip=all&ssl=1)


![Apple Shares Official Trailer for 'Long Way Home' Starring Ewan McGregor and Charley Boorman [Video]](https://www.iclarified.com/images/news/97069/97069/97069-640.jpg)
![Apple Watch Series 10 Back On Sale for $299! [Lowest Price Ever]](https://www.iclarified.com/images/news/96657/96657/96657-640.jpg)
![EU Postpones Apple App Store Fines Amid Tariff Negotiations [Report]](https://www.iclarified.com/images/news/97068/97068/97068-640.jpg)


![Mobile Legends: Bang Bang [MLBB] Free Redeem Codes April 2025](https://www.talkandroid.com/wp-content/uploads/2024/07/Screenshot_20240704-093036_Mobile-Legends-Bang-Bang.jpg)


Quantify your JIRA retrospectives to unlock the full team’s potential
How does your team conduct retrospectives? Do you rely on Confluence or Miro using techniques like “Start, Stop, Continue” or the 4Ls? Have you ever tried to measure whether your team has genuinely improved over time — whether over a quarter or a year? You might already be tracking DORA metrics, test pass rates, code coverage, or static analysis results — but how do you actually identify, categorize, and prioritize the underlying issues that are holding those metrics back? Chances are, most teams haven’t set up a clear system to track whether those root problems have been truly resolved — or even measured progress toward addressing them. In some rare cases, such a system might exist, but for most, it’s still uncharted territory, since extracting meaningful data from scattered visualization tools and sometimes chaoticly organized wiki pages is often a time-consuming process. Think about how many times have you labeled a problem as “TBD”, which eventually ended up in a backlog of other “TBDs” that you later had difficulty prioritizing? What happens when some of these require executive approval, such as securing additional budget to allocate more computing power for faster compilation or to run intensive test suites? In many cases, teams abandon their efforts to provide robust data, making it difficult to justify budget requests or prioritize lingering issues effectively. I’ve faced these challenges countless times. That’s why I developed Multi-team Metrics & Retrospective — a solution that transforms retrospectives into quantifiable, data-driven processes. One of the most crucial aspects of effective retrospectives is analyzing failed commitments, particularly incomplete scope. Through experience, I’ve found that the best way to drive improvement is by evaluating failed work items against well-defined metrics over a chosen time period — be it a sprint, month, quarter, half-year, year, or product release. To make this process seamless, a structured framework is essential. A Framework for Data-Driven Retrospectives To effectively track and improve team performance, we need: 1. Visualizing Key Metrics with Bar Charts Bar charts offer an intuitive way to track key retrospective metrics such as Uncompleted Scope, Unestimated Scope, etc. These charts can be configured to reflect different timeframes — sprints, months, quarters, half-years, or years — allowing teams to monitor progress over time. Displaying multiple teams within the same view provides a comprehensive perspective, especially when teams share a backlog or operate within the same domain. Since teams may define success differently, having the flexibility to create and track custom metrics adds further value. 2. In-Place Retrospective Analysis Rather than switching between tools, users should be able to click on a bar in the visualization, view the list of failed work items, and categorize them using a predefined but customizable dropdown. A dedicated space for documenting preventative measures ensures that retrospectives go beyond discussion and translate into actionable steps — all within a single interface. 3. Reports on Key Performance Blockers Teams should be able to generate reports that identify the top reasons for underperformance over any selected time period. Furthermore, these reports should enable historical comparisons — for example, tracking performance in 2024 vs. 2023 for a single team or multiple teams in the same domain (e.g., “Team1, Team2” in Domain ABC). This helps teams identify trends and measure improvement over time. 4. Drill-Down Capabilities for Granular Insights A high-level report is useful, but real insights come from the ability to drill down into details. If the reporting period is a year, teams should be able to explore how work items were distributed across half-years, quarters, months, or sprints — all from the same interface. This flexibility allows teams to pinpoint when and where performance bottlenecks emerged. … Why This Framework Works With these components in place, the common retrospective challenges vanish: Retrospective outcomes become quantifiable, accessible in two formats: bar charts with key metrics and pie charts summarizing failure reasons across different time periods. If you need to analyze work items that failed for the same reason, you simply click on the reason within the report. To identify the most pressing impediments, you can generate a priority-ordered report listing the most common failure reasons, along with the number of associated failed work items. Conversations about budget allocation or team performance with top management become data-driven and easier to justify. The Impact of a Data-Driven Approach Implementing this framework requires effort, but the rewards are immense. In my experience, the last team that adopted this structured approach achieved: 2x increase in delivery throughput and velocity 3x increase in flow efficie
How does your team conduct retrospectives? Do you rely on Confluence or Miro using techniques like “Start, Stop, Continue” or the 4Ls? Have you ever tried to measure whether your team has genuinely improved over time — whether over a quarter or a year?
You might already be tracking DORA metrics, test pass rates, code coverage, or static analysis results — but how do you actually identify, categorize, and prioritize the underlying issues that are holding those metrics back?
Chances are, most teams haven’t set up a clear system to track whether those root problems have been truly resolved — or even measured progress toward addressing them. In some rare cases, such a system might exist, but for most, it’s still uncharted territory, since extracting meaningful data from scattered visualization tools and sometimes chaoticly organized wiki pages is often a time-consuming process.
Think about how many times have you labeled a problem as “TBD”, which eventually ended up in a backlog of other “TBDs” that you later had difficulty prioritizing? What happens when some of these require executive approval, such as securing additional budget to allocate more computing power for faster compilation or to run intensive test suites? In many cases, teams abandon their efforts to provide robust data, making it difficult to justify budget requests or prioritize lingering issues effectively.
I’ve faced these challenges countless times. That’s why I developed Multi-team Metrics & Retrospective — a solution that transforms retrospectives into quantifiable, data-driven processes. One of the most crucial aspects of effective retrospectives is analyzing failed commitments, particularly incomplete scope. Through experience, I’ve found that the best way to drive improvement is by evaluating failed work items against well-defined metrics over a chosen time period — be it a sprint, month, quarter, half-year, year, or product release. To make this process seamless, a structured framework is essential.
A Framework for Data-Driven Retrospectives
To effectively track and improve team performance, we need:
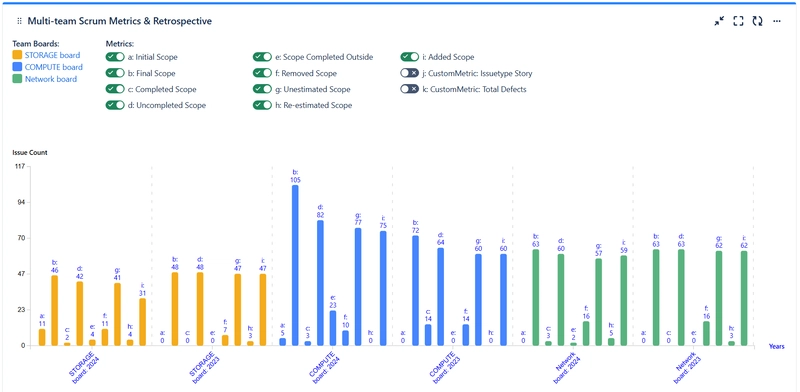
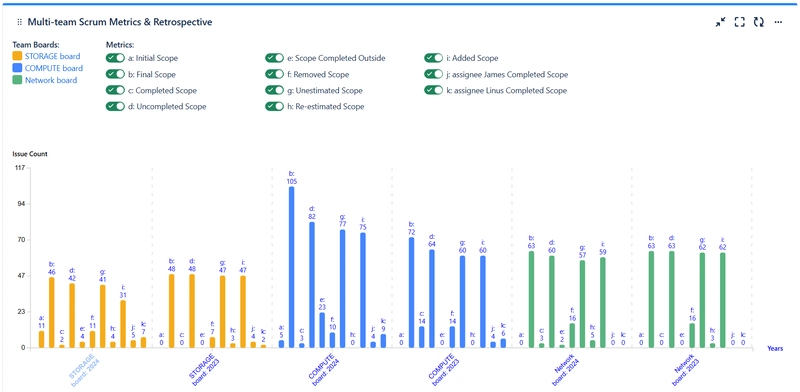
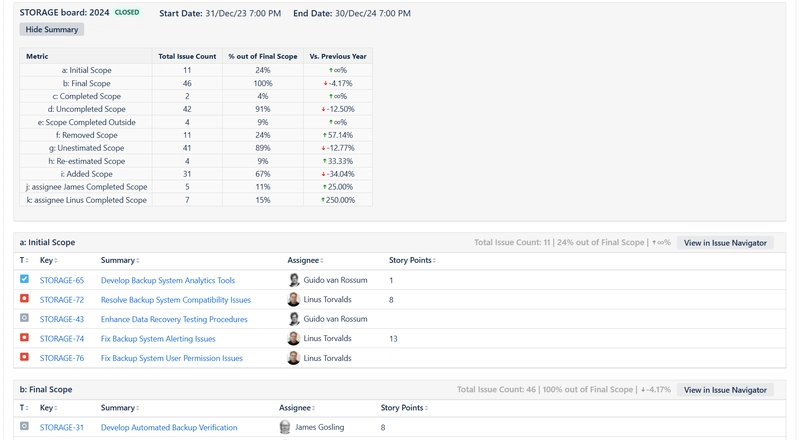
1. Visualizing Key Metrics with Bar Charts
Bar charts offer an intuitive way to track key retrospective metrics such as Uncompleted Scope, Unestimated Scope, etc. These charts can be configured to reflect different timeframes — sprints, months, quarters, half-years, or years — allowing teams to monitor progress over time. Displaying multiple teams within the same view provides a comprehensive perspective, especially when teams share a backlog or operate within the same domain. Since teams may define success differently, having the flexibility to create and track custom metrics adds further value.
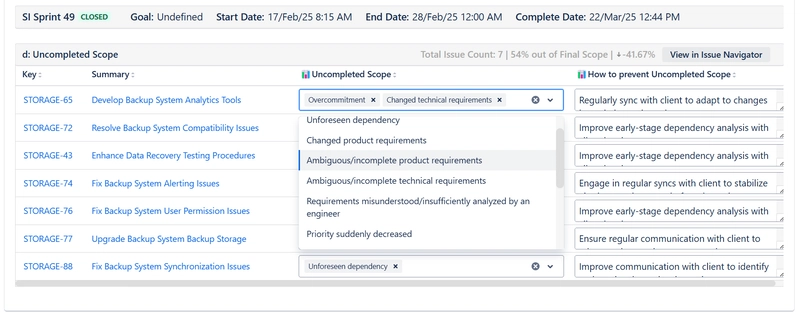
2. In-Place Retrospective Analysis
Rather than switching between tools, users should be able to click on a bar in the visualization, view the list of failed work items, and categorize them using a predefined but customizable dropdown. A dedicated space for documenting preventative measures ensures that retrospectives go beyond discussion and translate into actionable steps — all within a single interface.
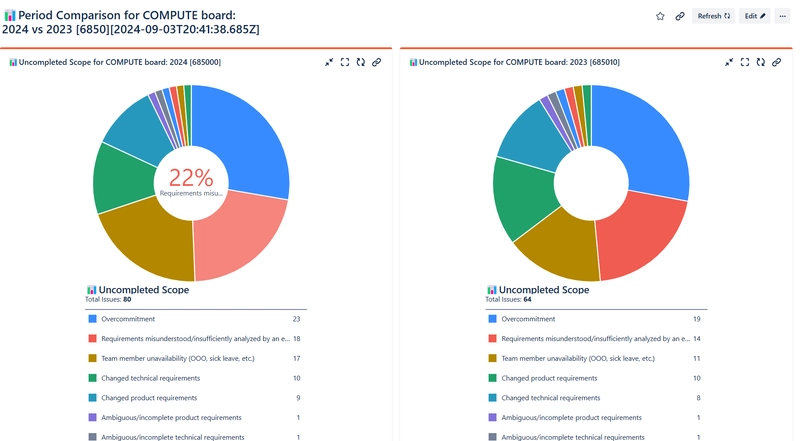
3. Reports on Key Performance Blockers
Teams should be able to generate reports that identify the top reasons for underperformance over any selected time period. Furthermore, these reports should enable historical comparisons — for example, tracking performance in 2024 vs. 2023 for a single team or multiple teams in the same domain (e.g., “Team1, Team2” in Domain ABC). This helps teams identify trends and measure improvement over time.
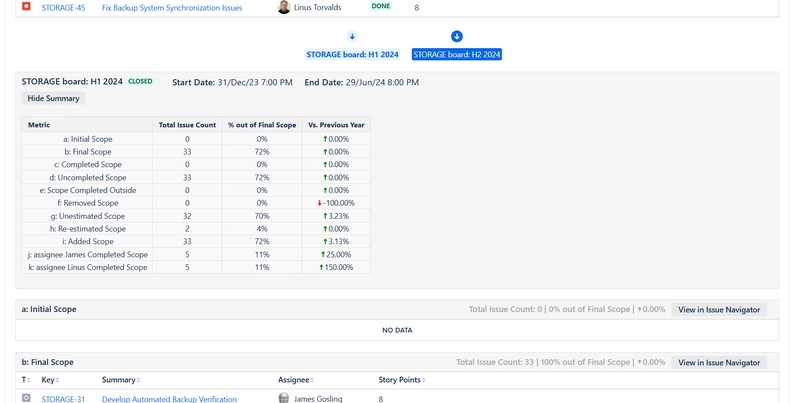
4. Drill-Down Capabilities for Granular Insights
A high-level report is useful, but real insights come from the ability to drill down into details. If the reporting period is a year, teams should be able to explore how work items were distributed across half-years, quarters, months, or sprints — all from the same interface. This flexibility allows teams to pinpoint when and where performance bottlenecks emerged.
…
Why This Framework Works
With these components in place, the common retrospective challenges vanish:
- Retrospective outcomes become quantifiable, accessible in two formats: bar charts with key metrics and pie charts summarizing failure reasons across different time periods.
- If you need to analyze work items that failed for the same reason, you simply click on the reason within the report.
- To identify the most pressing impediments, you can generate a priority-ordered report listing the most common failure reasons, along with the number of associated failed work items.
- Conversations about budget allocation or team performance with top management become data-driven and easier to justify.
The Impact of a Data-Driven Approach
Implementing this framework requires effort, but the rewards are immense. In my experience, the last team that adopted this structured approach achieved:
- 2x increase in delivery throughput and velocity
- 3x increase in flow efficiency
- 4x increase in planning accuracy and commitment fulfillment
Previously, I experimented with third-party apps and manual workarounds to implement parts of this framework in Jira. Eventually, I decided to develop a dedicated solution — Multi-team Metrics & Retrospective — to bring everything into one streamlined tool.