


![[The AI Show Episode 144]: ChatGPT’s New Memory, Shopify CEO’s Leaked “AI First” Memo, Google Cloud Next Releases, o3 and o4-mini Coming Soon & Llama 4’s Rocky Launch](https://www.marketingaiinstitute.com/hubfs/ep%20144%20cover.png)


![From fast food worker to cybersecurity engineer with Tae'lur Alexis [Podcast #169]](https://cdn.hashnode.com/res/hashnode/image/upload/v1745242807605/8a6cf71c-144f-4c91-9532-62d7c92c0f65.png?#)


![BPMN-procesmodellering [closed]](https://i.sstatic.net/l7l8q49F.png)


.jpg?#)
.jpg?#)


![CarPlay app with web browser for streaming video hits App Store [U]](https://i0.wp.com/9to5mac.com/wp-content/uploads/sites/6/2024/11/carplay-apple.jpeg?resize=1200%2C628&quality=82&strip=all&ssl=1)
![What’s new in Android’s April 2025 Google System Updates [U: 4/21]](https://i0.wp.com/9to5google.com/wp-content/uploads/sites/4/2025/01/google-play-services-3.jpg?resize=1200%2C628&quality=82&strip=all&ssl=1)


![Apple Releases iOS 18.5 Beta 3 and iPadOS 18.5 Beta 3 [Download]](https://www.iclarified.com/images/news/97076/97076/97076-640.jpg)
![Apple Seeds visionOS 2.5 Beta 3 to Developers [Download]](https://www.iclarified.com/images/news/97077/97077/97077-640.jpg)
![Apple Seeds tvOS 18.5 Beta 3 to Developers [Download]](https://www.iclarified.com/images/news/97078/97078/97078-640.jpg)
![Apple Seeds watchOS 11.5 Beta 3 to Developers [Download]](https://www.iclarified.com/images/news/97079/97079/97079-640.jpg)


Prometheus + Redis: Simple Guide to Monitor Redis Instances
Redis is often a critical part of modern infrastructure — whether used as a cache, message broker, or ephemeral store. Monitoring it properly helps you detect issues early and ensure system stability. In this guide, you’ll learn how to build a Redis monitoring dashboard with Prometheus and Grafana to quickly identify issues and improve system reliability. ⚙️ Installing Prometheus (Quick Setup) We’ll start by deploying Prometheus using Helm: helm repo add prometheus-community https://prometheus-community.github.io/helm-charts helm repo update helm install kube-prometheus prometheus-community/kube-prometheus-stack \ --namespace prometheus --create-namespace This will install Prometheus, Grafana, and some built-in exporters. To access Grafana: kubectl port-forward svc/kube-prometheus-grafana -n prometheus 3000:80 You can access here -> http://localhost:3000/login Default login: admin / prom-operator
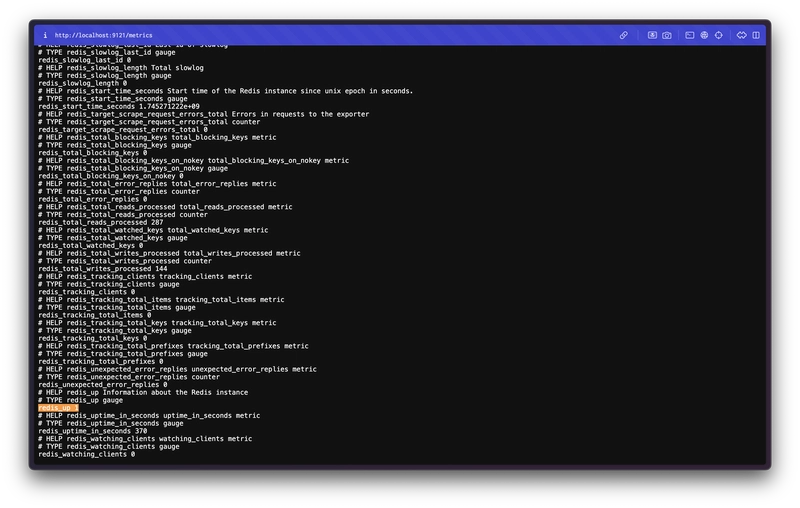
Redis is often a critical part of modern infrastructure — whether used as a cache, message broker, or ephemeral store. Monitoring it properly helps you detect issues early and ensure system stability.
In this guide, you’ll learn how to build a Redis monitoring dashboard with Prometheus and Grafana to quickly identify issues and improve system reliability.
⚙️ Installing Prometheus (Quick Setup)
We’ll start by deploying Prometheus using Helm:
helm repo add prometheus-community https://prometheus-community.github.io/helm-charts
helm repo update

helm install kube-prometheus prometheus-community/kube-prometheus-stack \
  --namespace prometheus --create-namespace
This will install Prometheus, Grafana, and some built-in exporters.
To access Grafana:
kubectl port-forward svc/kube-prometheus-grafana -n prometheus 3000:80
You can access here -> http://localhost:3000/login
Default login: admin / prom-operator