


![[Webinar] AI Is Already Inside Your SaaS Stack — Learn How to Prevent the Next Silent Breach](https://blogger.googleusercontent.com/img/b/R29vZ2xl/AVvXsEiOWn65wd33dg2uO99NrtKbpYLfcepwOLidQDMls0HXKlA91k6HURluRA4WXgJRAZldEe1VReMQZyyYt1PgnoAn5JPpILsWlXIzmrBSs_TBoyPwO7hZrWouBg2-O3mdeoeSGY-l9_bsZB7vbpKjTSvG93zNytjxgTaMPqo9iq9Z5pGa05CJOs9uXpwHFT4/s1600/ai-cyber.jpg?#)


![[The AI Show Episode 144]: ChatGPT’s New Memory, Shopify CEO’s Leaked “AI First” Memo, Google Cloud Next Releases, o3 and o4-mini Coming Soon & Llama 4’s Rocky Launch](https://www.marketingaiinstitute.com/hubfs/ep%20144%20cover.png)


![Rogue Company Elite tier list of best characters [April 2025]](https://media.pocketgamer.com/artwork/na-33136-1657102075/rogue-company-ios-android-tier-cover.jpg?#)


_Andreas_Prott_Alamy.jpg?width=1280&auto=webp&quality=80&disable=upscale#)


![What’s new in Android’s April 2025 Google System Updates [U: 4/18]](https://i0.wp.com/9to5google.com/wp-content/uploads/sites/4/2025/01/google-play-services-3.jpg?resize=1200%2C628&quality=82&strip=all&ssl=1)


![Apple Watch Series 10 Back On Sale for $299! [Lowest Price Ever]](https://www.iclarified.com/images/news/96657/96657/96657-640.jpg)
![EU Postpones Apple App Store Fines Amid Tariff Negotiations [Report]](https://www.iclarified.com/images/news/97068/97068/97068-640.jpg)
![Apple Slips to Fifth in China's Smartphone Market with 9% Decline [Report]](https://www.iclarified.com/images/news/97065/97065/97065-640.jpg)


Optimizing 600k+ Rows in Atlassian Forge SQL: Performance Under 16MB and 5s
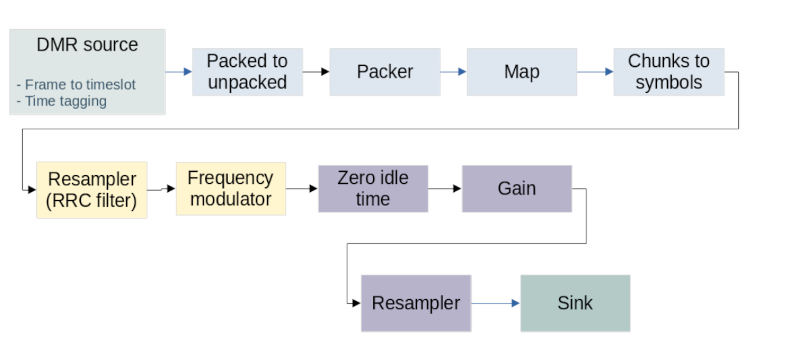
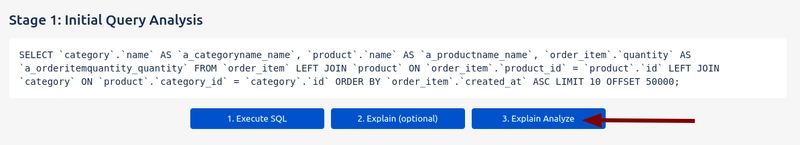
Optimizing SQL Queries in Atlassian Forge In this article, we’ll work with a large dataset exceeding 600,000 records and walk through how to optimize SQL queries to stay within the strict Forge SQL limitations—particularly the 16 MB memory quota and the 5-second read timeout. I’ll demonstrate how to write efficient SQL using indexes, pagination strategies, and EXPLAIN plans to achieve sub-second execution times and low memory consumption, even with large OFFSET values. We’ll walk through a real-world example of optimizing complex SQL queries in Atlassian Forge. You’ll see how query performance can drastically improve when working with large datasets inside the Forge runtime. To measure and improve query performance, we’ll use EXPLAIN and EXPLAIN ANALYZE—powerful tools supported by TiDB that help us understand execution plans, memory usage, and performance bottlenecks. EXPLAIN generates a query plan without executing the query. It shows the order of operations, join types, scan strategies, and whether indexes will be used. EXPLAIN ANALYZE goes one step further—it executes the query and displays actual execution times, memory consumption, disk usage, and other runtime details. This is especially useful for diagnosing performance problems or validating optimizations.
Optimizing SQL Queries in Atlassian Forge
In this article, we’ll work with a large dataset exceeding 600,000 records and walk through how to optimize SQL queries to stay within the strict Forge SQL limitations—particularly the 16 MB memory quota and the 5-second read timeout. I’ll demonstrate how to write efficient SQL using indexes, pagination strategies, and EXPLAIN plans to achieve sub-second execution times and low memory consumption, even with large OFFSET values.
We’ll walk through a real-world example of optimizing complex SQL queries in Atlassian Forge. You’ll see how query performance can drastically improve when working with large datasets inside the Forge runtime.
To measure and improve query performance, we’ll use EXPLAIN and EXPLAIN ANALYZE—powerful tools supported by TiDB that help us understand execution plans, memory usage, and performance bottlenecks.
- EXPLAIN generates a query plan without executing the query. It shows the order of operations, join types, scan strategies, and whether indexes will be used.
- EXPLAIN ANALYZE goes one step further—it executes the query and displays actual execution times, memory consumption, disk usage, and other runtime details. This is especially useful for diagnosing performance problems or validating optimizations.