Observability in Microservices Architecture
Microservices architecture is a powerful approach to building scalable and flexible systems by breaking applications into smaller, independent services. However, with this flexibility comes complexity. Managing and understanding the behavior of distributed systems can be challenging, especially when issues arise. This is where observability becomes critical. Observability is the ability to gain deep insights into the internal workings of a system by analyzing its outputs, such as logs, metrics, and traces. It goes beyond traditional monitoring by enabling teams to diagnose issues, optimize performance, and ensure reliability in complex microservices environments. Let’s dive into observability in microservices architecture, its core components, and how it addresses the challenges of modern distributed systems. What Makes Observability Different from Monitoring? While monitoring focuses on tracking predefined metrics and alerting for known issues (e.g., CPU usage or memory thresholds), observability provides a more holistic view. It allows teams to explore "unknown unknowns"—issues that haven’t been anticipated—by analyzing system behavior in real-time. Monitoring: Reactive; answers "what went wrong?" Observability: Proactive; answers "why did it go wrong?" and helps predict future issues. In a microservices environment, where hundreds of services interact dynamically, observability is indispensable for maintaining system health. The Three Pillars of Observability The foundation of observability lies in three key data types: logs, metrics, and traces. Together, they provide a complete picture of system behavior. 1. Logs: The Storytellers Logs are detailed records of events that occur within a system. Each log entry captures information such as timestamps, service names, error codes, and user actions. Logs are essential for debugging and post-mortem analysis because they provide context about what happened at specific points in time. Example: A log might record an error when a payment service fails to process a transaction. Structured logging (e.g., JSON format) makes it easier to search and analyze log data across services. 2. Metrics: The Performance Indicators Metrics are numerical measurements that track system performance over time. Examples include request rates, response times, error rates, CPU usage, and memory consumption. Metrics allow teams to monitor trends and set thresholds for alerts. 3. Traces: The Pathfinders Traces track the journey of a request as it flows through multiple services in a distributed system. They provide end-to-end visibility into how services interact and where delays or failures occur. Example: A trace might show that an API request spends 50ms in the authentication service, 200ms in the database service, and 30ms in the payment service. Distributed tracing tools like Jaeger or Zipkin help pinpoint bottlenecks and optimize request flows. Key Observability Patterns for Microservices To implement observability effectively in microservices architecture, teams use specific design patterns that enhance visibility and streamline issue resolution: 1. Centralized Logging All microservices send their logs to a central repository (e.g., ELK Stack or Splunk). This makes it easier to search and analyze logs across the entire system without jumping between individual services. 2. Distributed Tracing This pattern tracks requests across multiple services to provide a complete view of their journey. It’s invaluable for identifying latency issues or failures in complex workflows. 3. Metrics Collection Each service exposes performance metrics that are aggregated into dashboards using tools like Prometheus or Grafana. These dashboards provide real-time insights into system health. 4. Health Checks Microservices expose health check endpoints that indicate their availability (e.g., readiness and liveness probes in Kubernetes). Load balancers use these checks to route traffic only to healthy instances. 5. Error Budgets Teams set acceptable thresholds for errors within a given period (e.g., 99.9% uptime). If the error budget is exceeded, resources are allocated to improve reliability instead of adding new features. Challenges of Observability in Microservices While observability offers immense benefits, it also comes with challenges: Data Overload: With hundreds of services generating logs, metrics, and traces, managing large volumes of data can be overwhelming. Correlation Complexity: Analyzing data across multiple services requires correlating logs, metrics, and traces effectively. Dynamic Environments: In containerized systems like Kubernetes, services scale up or down frequently, making it harder to maintain consistent observability. Tool Integration: Selecting and integrating the right tools (e.g., Jaeger for tracing or Prometheus for metrics) can be complex. Best Practices for Implementing Observability To overcome these challenges and maximize the benefits of obse

Microservices architecture is a powerful approach to building scalable and flexible systems by breaking applications into smaller, independent services. However, with this flexibility comes complexity. Managing and understanding the behavior of distributed systems can be challenging, especially when issues arise. This is where observability becomes critical.
Observability is the ability to gain deep insights into the internal workings of a system by analyzing its outputs, such as logs, metrics, and traces. It goes beyond traditional monitoring by enabling teams to diagnose issues, optimize performance, and ensure reliability in complex microservices environments. Let’s dive into observability in microservices architecture, its core components, and how it addresses the challenges of modern distributed systems.
What Makes Observability Different from Monitoring?
While monitoring focuses on tracking predefined metrics and alerting for known issues (e.g., CPU usage or memory thresholds), observability provides a more holistic view. It allows teams to explore "unknown unknowns"—issues that haven’t been anticipated—by analyzing system behavior in real-time.
Monitoring: Reactive; answers "what went wrong?"
Observability: Proactive; answers "why did it go wrong?" and helps predict future issues.
In a microservices environment, where hundreds of services interact dynamically, observability is indispensable for maintaining system health.
The Three Pillars of Observability
The foundation of observability lies in three key data types: logs, metrics, and traces. Together, they provide a complete picture of system behavior.
1. Logs: The Storytellers
Logs are detailed records of events that occur within a system. Each log entry captures information such as timestamps, service names, error codes, and user actions. Logs are essential for debugging and post-mortem analysis because they provide context about what happened at specific points in time.
Example:
A log might record an error when a payment service fails to process a transaction.
Structured logging (e.g., JSON format) makes it easier to search and analyze log data across services.
2. Metrics: The Performance Indicators
Metrics are numerical measurements that track system performance over time. Examples include request rates, response times, error rates, CPU usage, and memory consumption. Metrics allow teams to monitor trends and set thresholds for alerts.
3. Traces: The Pathfinders
Traces track the journey of a request as it flows through multiple services in a distributed system. They provide end-to-end visibility into how services interact and where delays or failures occur.
Example:
A trace might show that an API request spends 50ms in the authentication service, 200ms in the database service, and 30ms in the payment service.
Distributed tracing tools like Jaeger or Zipkin help pinpoint bottlenecks and optimize request flows.
Key Observability Patterns for Microservices
To implement observability effectively in microservices architecture, teams use specific design patterns that enhance visibility and streamline issue resolution:
1. Centralized Logging
All microservices send their logs to a central repository (e.g., ELK Stack or Splunk). This makes it easier to search and analyze logs across the entire system without jumping between individual services.
2. Distributed Tracing
This pattern tracks requests across multiple services to provide a complete view of their journey. It’s invaluable for identifying latency issues or failures in complex workflows.
3. Metrics Collection
Each service exposes performance metrics that are aggregated into dashboards using tools like Prometheus or Grafana. These dashboards provide real-time insights into system health.
4. Health Checks
Microservices expose health check endpoints that indicate their availability (e.g., readiness and liveness probes in Kubernetes). Load balancers use these checks to route traffic only to healthy instances.
5. Error Budgets
Teams set acceptable thresholds for errors within a given period (e.g., 99.9% uptime). If the error budget is exceeded, resources are allocated to improve reliability instead of adding new features.
Challenges of Observability in Microservices
While observability offers immense benefits, it also comes with challenges:
Data Overload: With hundreds of services generating logs, metrics, and traces, managing large volumes of data can be overwhelming.
Correlation Complexity: Analyzing data across multiple services requires correlating logs, metrics, and traces effectively.
Dynamic Environments: In containerized systems like Kubernetes, services scale up or down frequently, making it harder to maintain consistent observability.
Tool Integration: Selecting and integrating the right tools (e.g., Jaeger for tracing or Prometheus for metrics) can be complex.
Best Practices for Implementing Observability
To overcome these challenges and maximize the benefits of observability:
Plan Observability from the Start:
Design microservices to emit structured logs, metrics, and traces from day one.
Define key performance indicators (KPIs) for each service.
Use Centralized Tools:
Adopt platforms like OpenObserve or Datadog to consolidate observability data.
Ensure tools support real-time monitoring and alerting.
Automate Data Collection:
Use agents or libraries to automatically collect telemetry data from services.
Avoid manual instrumentation wherever possible.
Correlate Data Across Pillars:
Combine logs, metrics, and traces to gain actionable insights.
For example: Use traces to identify slow requests and then analyze logs for root causes.
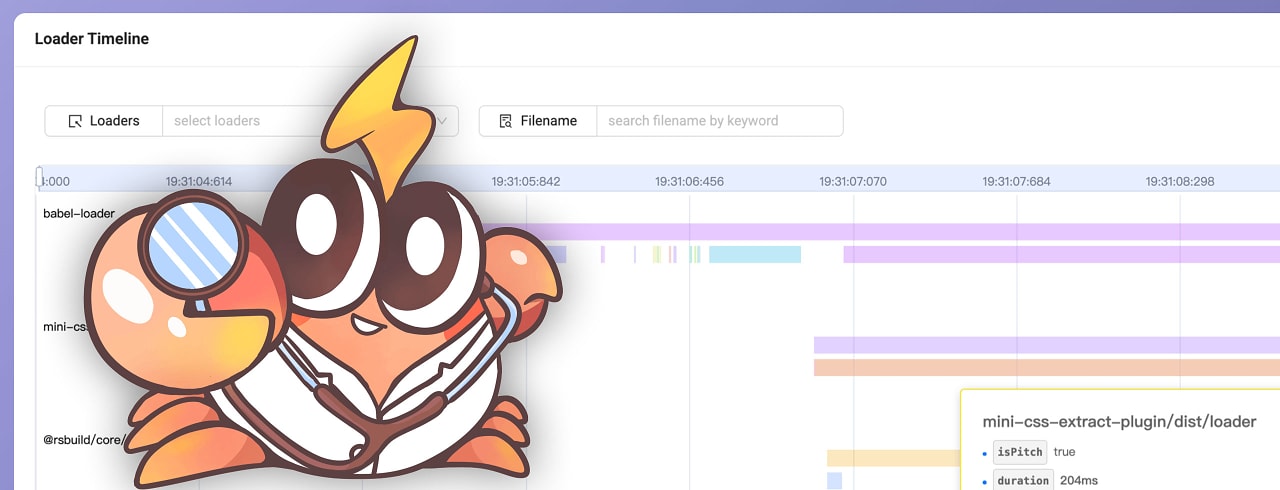
Visualize Data Effectively:
Create intuitive dashboards that highlight critical metrics and trends.
Use heatmaps or graphs to quickly identify anomalies.
Regularly Review Observability Strategy:
As your system evolves, revisit your observability goals and tools.
Scale observability practices alongside your microservices architecture.
Benefits of Observability in Microservices
Effective observability provides several advantages:
Faster Issue Resolution: Quickly identify root causes of failures using correlated data.
Improved Performance Optimization: Gain insights into bottlenecks and optimize resource usage.
Enhanced Reliability: Detect anomalies early to prevent cascading failures.
Better User Experience: Ensure consistent application performance by addressing issues proactively.
Streamlined Compliance: Meet audit requirements by maintaining detailed logs and metrics.
Conclusion
Observability is no longer optional in modern microservices architecture - it is essential for managing complexity and ensuring reliability at scale. By leveraging the three pillars: logs, metrics, and traces, and adopting key patterns like centralized logging and distributed tracing, teams can gain deep insights into their systems’ behavior.
With strong observability practices in place, organizations can build resilient systems that not only perform well but also adapt seamlessly to changing demands, delivering better outcomes for both users and businesses alike!




























![[The AI Show Episode 142]: ChatGPT’s New Image Generator, Studio Ghibli Craze and Backlash, Gemini 2.5, OpenAI Academy, 4o Updates, Vibe Marketing & xAI Acquires X](https://www.marketingaiinstitute.com/hubfs/ep%20142%20cover.png)


















































![[FREE EBOOKS] The Kubernetes Bible, The Ultimate Linux Shell Scripting Guide & Four More Best Selling Titles](https://www.javacodegeeks.com/wp-content/uploads/2012/12/jcg-logo.jpg)


![From drop-out to software architect with Jason Lengstorf [Podcast #167]](https://cdn.hashnode.com/res/hashnode/image/upload/v1743796461357/f3d19cd7-e6f5-4d7c-8bfc-eb974bc8da68.png?#)























.png?#)


.jpg?#)


 (1).webp?#)







_Christophe_Coat_Alamy.jpg?#)



















![Rapidus in Talks With Apple as It Accelerates Toward 2nm Chip Production [Report]](https://www.iclarified.com/images/news/96937/96937/96937-640.jpg)


