Monitoring What Matters: Practical Alerting for Scalable Systems
Introduction In modern distributed systems, performance isn't just about speed—it's about balancing latency, availability, and resource efficiency at scale. Effective alerting is essential for maintaining this balance. Without it, teams may miss real failures, overreact to false positives, or remain blind to slow degradation. This guide lays out a practical approach to designing alerts that matter—so you can catch what’s broken, ignore what’s not, and scale confidently. [1][2] Alerts depend on the type of service being monitored. Customer-facing services need different alerts than backend systems or batch jobs. But no matter the service, you should at least set alerts for these key areas. Availability Availability just means that the system is ready to do its job. For services that take requests, it means the service is running and can handle any incoming requests. For backend processes, it means the system is either working right now or ready to start when there are tasks to handle. Latency Latency is how long it takes for your system to do something. For a service, it’s the time it takes from when a request comes in to when the response is sent out. This is the total time for the request to travel to the service and the response to go back. However, we can only measure latency from the service’s side, so things like network delays or other issues outside the service aren’t counted. For backend processes, latency is how long it takes to finish a task—like processing a message from a queue, completing a step in a workflow, or finishing a batch job. Compute metrics Compute metrics track things like CPU usage, memory usage, disk space, etc. These alerts help make sure individual servers aren’t causing problems that might get hidden in overall system metrics. Call volume They help protect your service from hitting its limits and let you know if you need to scale up. These alerts should track the total number of requests your service can handle at its current size, including limits on your servers and any dependencies. Deciding Severity Severity should reflect how critical the system is and how urgent the issue is to fix. If you create a high severity alert, it's a good idea to also create a low severity alert at a more sensitive level. This acts as an early alert to catch issues before they escalate. For some services, only low severity alerts may work well in case of very low customer impact. Setting thresholds Threshold setting depends on the SLA of the services. If the service impacts a large customer base then the thresholds can be sensitive. Availability Latency P50 (50th percentile) is the median latency, meaning half of the requests are processed faster, and half take longer. P90 (90th percentile) is the latency where 90% of the requests are faster, and 10% take longer. P99 (99th percentile) is the latency where 99% of the requests are faster, and only 1% take longer. P99.9 (99.9th percentile) is the latency where 99.9% of the requests are faster, and only 0.1% take longer. Threshold values should be set based on your SLA and the past performance of your application. The highest threshold should match your SLA or your client’s expectations. If your service is causing latency, it’s important that your system alerts you before your clients notice. To set the maximum threshold, check with your clients to understand their SLAs. For the minimum threshold, review your service’s performance over at least the last 45 days. Consider any recent or upcoming changes, like increased traffic, a new API, new dependencies. Compute metrics Compute metrics should be set on CPU usage e.g. alert when CPU usage is higher than 80%. Similarly for memory usage, disk space, etc Call volume The call volume threshold should be set just below the point where the service starts to break or fail. Notification channels In order to alert the on-call to notify for the alert to take immediate actions, there can be various notification channels integrated with the alert framework. Conclusion Good alerts help teams catch problems early and fix them before they impact users. It’s important to set alerts for key areas like availability, latency, compute usage, and call volume. Each service is different, so alerts should match the type of service and how critical it is. Setting the right severity and thresholds helps reduce noise and focus attention on real issues. Using the right notification channels makes sure the right people get alerted in time. With clear alerts and smart settings, teams can keep systems healthy and reliable. References Datadoghq Blogs. (2015). Monitoring 101: Alerting on what matters https://www.datadoghq.com/blog/monitoring-101-alerting Microsoft Blogs. (2014). Recommendations for designing a reliable monitoring and alerting strategy
Introduction
In modern distributed systems, performance isn't just about speed—it's about balancing latency, availability, and resource efficiency at scale. Effective alerting is essential for maintaining this balance. Without it, teams may miss real failures, overreact to false positives, or remain blind to slow degradation. This guide lays out a practical approach to designing alerts that matter—so you can catch what’s broken, ignore what’s not, and scale confidently. [1][2]
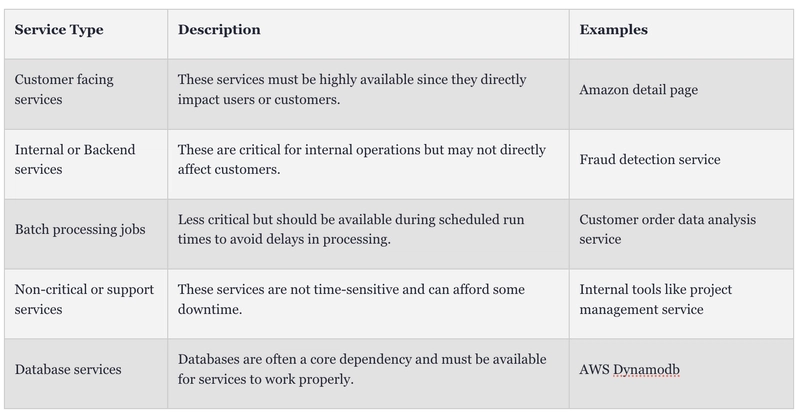
Alerts depend on the type of service being monitored. Customer-facing services need different alerts than backend systems or batch jobs. But no matter the service, you should at least set alerts for these key areas.
Availability
Availability just means that the system is ready to do its job. For services that take requests, it means the service is running and can handle any incoming requests. For backend processes, it means the system is either working right now or ready to start when there are tasks to handle.
Latency
Latency is how long it takes for your system to do something. For a service, it’s the time it takes from when a request comes in to when the response is sent out. This is the total time for the request to travel to the service and the response to go back. However, we can only measure latency from the service’s side, so things like network delays or other issues outside the service aren’t counted.
For backend processes, latency is how long it takes to finish a task—like processing a message from a queue, completing a step in a workflow, or finishing a batch job.
Compute metrics
Compute metrics track things like CPU usage, memory usage, disk space, etc. These alerts help make sure individual servers aren’t causing problems that might get hidden in overall system metrics.
Call volume
They help protect your service from hitting its limits and let you know if you need to scale up. These alerts should track the total number of requests your service can handle at its current size, including limits on your servers and any dependencies.
Deciding Severity
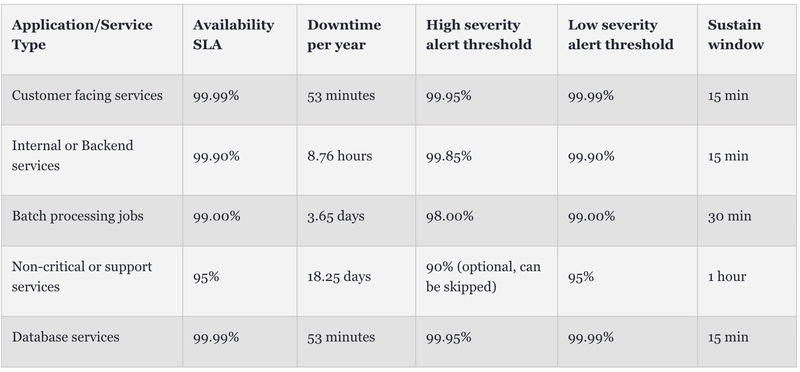
Severity should reflect how critical the system is and how urgent the issue is to fix. If you create a high severity alert, it's a good idea to also create a low severity alert at a more sensitive level. This acts as an early alert to catch issues before they escalate.
For some services, only low severity alerts may work well in case of very low customer impact.
Setting thresholds
Threshold setting depends on the SLA of the services. If the service impacts a large customer base then the thresholds can be sensitive.

Availability
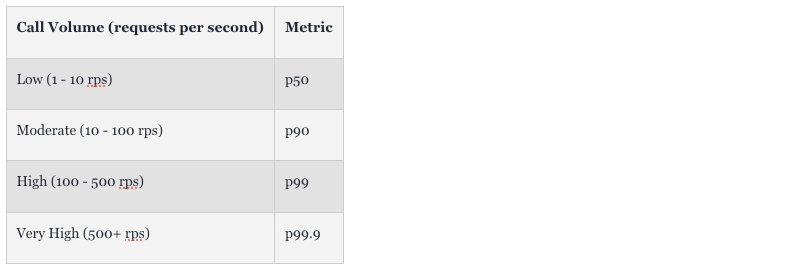
Latency
P50 (50th percentile) is the median latency, meaning half of the requests are processed faster, and half take longer.
P90 (90th percentile) is the latency where 90% of the requests are faster, and 10% take longer.
P99 (99th percentile) is the latency where 99% of the requests are faster, and only 1% take longer.
P99.9 (99.9th percentile) is the latency where 99.9% of the requests are faster, and only 0.1% take longer.
Threshold values should be set based on your SLA and the past performance of your application. The highest threshold should match your SLA or your client’s expectations. If your service is causing latency, it’s important that your system alerts you before your clients notice.
To set the maximum threshold, check with your clients to understand their SLAs.
For the minimum threshold, review your service’s performance over at least the last 45 days. Consider any recent or upcoming changes, like increased traffic, a new API, new dependencies.
Compute metrics
Compute metrics should be set on CPU usage e.g. alert when CPU usage is higher than 80%. Similarly for memory usage, disk space, etc
Call volume
The call volume threshold should be set just below the point where the service starts to break or fail.
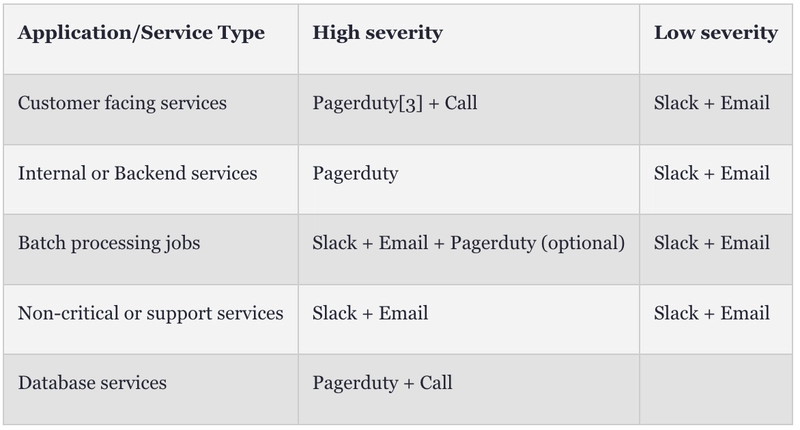
Notification channels
In order to alert the on-call to notify for the alert to take immediate actions, there can be various notification channels integrated with the alert framework.
Conclusion
Good alerts help teams catch problems early and fix them before they impact users. It’s important to set alerts for key areas like availability, latency, compute usage, and call volume. Each service is different, so alerts should match the type of service and how critical it is.
Setting the right severity and thresholds helps reduce noise and focus attention on real issues. Using the right notification channels makes sure the right people get alerted in time. With clear alerts and smart settings, teams can keep systems healthy and reliable.
References
Datadoghq Blogs. (2015). Monitoring 101: Alerting on what matters
https://www.datadoghq.com/blog/monitoring-101-alertingMicrosoft Blogs. (2014). Recommendations for designing a reliable monitoring and alerting strategy https://learn.microsoft.com/en-us/azure/well-architected/reliability/monitoring-alerting-strategy
Medium. (2024). Managing Critical Alerts through PagerDuty’s Event Rules https://medium.com/@davidcesc/managing-critical-alerts-through-pagerdutys-event-rules-2c7014eded3d
About me
I am a Senior Staff Software Engineer at Uber with over a decade of experience in scalable, high-performance distributed systems. I have worked on cloud-native architectures, database optimization, and building large-scale distributed systems
Connect with me at Linkedin




























![[The AI Show Episode 142]: ChatGPT’s New Image Generator, Studio Ghibli Craze and Backlash, Gemini 2.5, OpenAI Academy, 4o Updates, Vibe Marketing & xAI Acquires X](https://www.marketingaiinstitute.com/hubfs/ep%20142%20cover.png)




































![[FREE EBOOKS] The Kubernetes Bible, The Ultimate Linux Shell Scripting Guide & Four More Best Selling Titles](https://www.javacodegeeks.com/wp-content/uploads/2012/12/jcg-logo.jpg)


![From drop-out to software architect with Jason Lengstorf [Podcast #167]](https://cdn.hashnode.com/res/hashnode/image/upload/v1743796461357/f3d19cd7-e6f5-4d7c-8bfc-eb974bc8da68.png?#)
















.png?#)


.jpg?#)


 (1).webp?#)





_Christophe_Coat_Alamy.jpg?#)














![Rapidus in Talks With Apple as It Accelerates Toward 2nm Chip Production [Report]](https://www.iclarified.com/images/news/96937/96937/96937-640.jpg)


