


![[The AI Show Episode 143]: ChatGPT Revenue Surge, New AGI Timelines, Amazon’s AI Agent, Claude for Education, Model Context Protocol & LLMs Pass the Turing Test](https://www.marketingaiinstitute.com/hubfs/ep%20143%20cover.png)


![Is this too much for a modular monolith system? [closed]](https://i.sstatic.net/pYL1nsfg.png)


-The-Elder-Scrolls-IV-Oblivion-Remastered---Official-Reveal-00-18-14.png?width=1920&height=1920&fit=bounds&quality=70&format=jpg&auto=webp#)


_roibu_Alamy.jpg?width=1280&auto=webp&quality=80&disable=upscale#)


 CISO’s Core Focus.webp?#)


![iPadOS 19 May Introduce Menu Bar, iOS 19 to Support External Displays [Rumor]](https://www.iclarified.com/images/news/97137/97137/97137-640.jpg)

![Apple Drops New Immersive Adventure Episode for Vision Pro: 'Hill Climb' [Video]](https://www.iclarified.com/images/news/97133/97133/97133-640.jpg)


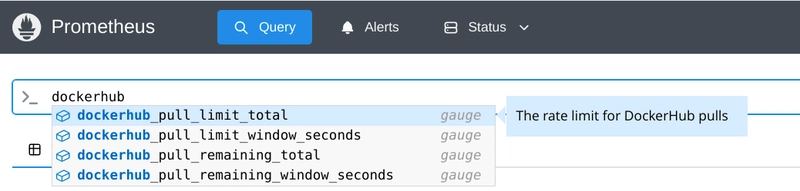
Monitoring Docker Hub limits with Prometheus
The problem Once upon a time, Docker decided to spoil us all developers and operators and had unlimited access to Docker Hub. You could pull as many images, as many times as your heart desired without any constraint, so we got used to it and never really thought about how good of a deal was that. Unfortunately, free and unlimited almost never go hand to hand and the day came when Docker decided to impose limits to how much you can pull from the mothership. At this point (April 2025) the limits have changed twice and the current numbers can be found at https://docs.docker.com/docker-hub/usage/. Many of us just created users for those machines with heavy docker pull usage and for most of it, it was fine. Until eventually something breaks. We started using caches where possible, but in some cases, the need for direct access was still there and therefore the need to know how much more can we pull for now and if any account had run dry. Prometheus + Alertmanager + Grafana If you've been operating services for the last decade, chances are you've meet these tools. For the uninitiated: Prometheus is used to collect metrics of your systems over time. Alertmanager Takes care of handling alerts and distributing them to the right receiver. Grafana Is used to visualize metrics, logs, traces, and by the time you read this probably other things
The problem
Once upon a time, Docker decided to spoil us all developers and operators and had unlimited access to Docker Hub. You could pull as many images, as many times as your heart desired without any constraint, so we got used to it and never really thought about how good of a deal was that.
Unfortunately, free and unlimited almost never go hand to hand and the day came when Docker decided to impose limits to how much you can pull from the mothership. At this point (April 2025) the limits have changed twice and the current numbers can be found at https://docs.docker.com/docker-hub/usage/.
Many of us just created users for those machines with heavy docker pull usage and for most of it, it was fine. Until eventually something breaks. We started using caches where possible, but in some cases, the need for direct access was still there and therefore the need to know how much more can we pull for now and if any account had run dry.
Prometheus + Alertmanager + Grafana
If you've been operating services for the last decade, chances are you've meet these tools.
For the uninitiated:
- Prometheus is used to collect metrics of your systems over time.
- Alertmanager Takes care of handling alerts and distributing them to the right receiver.
- Grafana Is used to visualize metrics, logs, traces, and by the time you read this probably other things