


![[Webinar] AI Is Already Inside Your SaaS Stack — Learn How to Prevent the Next Silent Breach](https://blogger.googleusercontent.com/img/b/R29vZ2xl/AVvXsEiOWn65wd33dg2uO99NrtKbpYLfcepwOLidQDMls0HXKlA91k6HURluRA4WXgJRAZldEe1VReMQZyyYt1PgnoAn5JPpILsWlXIzmrBSs_TBoyPwO7hZrWouBg2-O3mdeoeSGY-l9_bsZB7vbpKjTSvG93zNytjxgTaMPqo9iq9Z5pGa05CJOs9uXpwHFT4/s1600/ai-cyber.jpg?#)


![[The AI Show Episode 144]: ChatGPT’s New Memory, Shopify CEO’s Leaked “AI First” Memo, Google Cloud Next Releases, o3 and o4-mini Coming Soon & Llama 4’s Rocky Launch](https://www.marketingaiinstitute.com/hubfs/ep%20144%20cover.png)


![Rogue Company Elite tier list of best characters [April 2025]](https://media.pocketgamer.com/artwork/na-33136-1657102075/rogue-company-ios-android-tier-cover.jpg?#)


_Andreas_Prott_Alamy.jpg?width=1280&auto=webp&quality=80&disable=upscale#)


![What’s new in Android’s April 2025 Google System Updates [U: 4/18]](https://i0.wp.com/9to5google.com/wp-content/uploads/sites/4/2025/01/google-play-services-3.jpg?resize=1200%2C628&quality=82&strip=all&ssl=1)


![Apple Watch Series 10 Back On Sale for $299! [Lowest Price Ever]](https://www.iclarified.com/images/news/96657/96657/96657-640.jpg)
![EU Postpones Apple App Store Fines Amid Tariff Negotiations [Report]](https://www.iclarified.com/images/news/97068/97068/97068-640.jpg)
![Apple Slips to Fifth in China's Smartphone Market with 9% Decline [Report]](https://www.iclarified.com/images/news/97065/97065/97065-640.jpg)


Datadog is more than just a monitoring tool — it’s a full-stack observability platform that empowers developers, DevOps engineers, SREs, and even business teams to monitor, debug, optimize, and secure applications and infrastructure. Here’s a breakdown of how Datadog supports different stages and areas of the development and operations lifecycle: Application Performance Monitoring (APM) Use Case: Identify Slow Code & Optimize Bottlenecks Tracks end-to-end performance of .NET Core, Java, Node.js, Python, and more. Visualizes method-level execution time, external dependencies (DBs, APIs), and latency. Provides service maps, flame graphs, and spans to isolate slow or failing areas. Example: A POST /api/order/checkout request takes 5 seconds. APM shows 3.5 seconds are spent on a SQL join, helping the dev fix the DB query. Logs Management & Analysis Use Case: Centralize, Search & Correlate Logs Across Services Ingest logs from apps, servers, containers, firewalls, and more. Supports parsing, filtering, tagging, and alerting on logs. You can correlate logs with traces, helping pinpoint context fast. Example: A user reports a payment failure. Devs search logs for their email, see the stack trace, and click into the corresponding trace to understand what broke. Real-Time Metrics Monitoring Use Case: Monitor System Health & Custom Business Metrics Tracks infrastructure (CPU, memory, I/O) and app-specific metrics. Supports custom metrics via SDKs for .NET, Python, Java, etc. Dashboards visualize real-time & historical data for fast decision-making. Example: Developers track ItemsInCart.Count across time and regions to understand shopping trends or detect sudden drops. Distributed Tracing Use Case: Debug Across Microservices & Understand Dependencies See how a request flows through multiple services (microservices or serverless). Understand timing and failures at each step. Detect high-latency internal calls or timeout-prone external APIs. Example: A request flows through Auth → User → Billing → Notification services. You spot a 2s delay in Billing caused by an overloaded Redis instance. Infrastructure Monitoring Use Case: Visualize & Alert on Infrastructure in Cloud, Hybrid, or On-Prem Automatically discovers EC2, Azure VMs, GCP instances, Kubernetes nodes, Docker containers, and more. Provides live heatmaps, topology maps, and health overviews. Tracks disk usage, open connections, network traffic, etc. Example: A .NET app running in Azure AKS crashes intermittently. Datadog shows the node has disk pressure and evictions. Error Tracking Use Case: Identify, Aggregate & Prioritize Production Errors Tracks exceptions in your app: .NET, JavaScript, etc. Groups them by stack trace and frequency. Allows you to set alerts on new or high-volume errors. Example: After a deployment, 300+ NullReferenceException logs spike. Datadog notifies the dev team instantly, and they roll back before users notice. Synthetic Monitoring Use Case: Ensure Uptime & Measure End-User Experience Automates browser or HTTP tests against APIs and websites. Can simulate logins, form fills, and flows (e.g., checkout process). Checks from multiple global locations for regional issues. Example: Datadog detects a failed login flow at 2 AM via synthetics and alerts DevOps before users wake up. Real User Monitoring (RUM) Use Case: Understand How Users Experience Your Frontend Tracks page load time, JS errors, AJAX calls, and user sessions. Detects slow assets or unhandled exceptions affecting UX. Filters by browser, location, OS, user ID. Example: Users on Safari 17.3 report lag. Datadog shows high Largest Contentful Paint (LCP) times for that browser only. Security Monitoring Use Case: Detect Security Threats & Misconfigurations Analyzes logs for suspicious activity (e.g., SQL injection attempts, brute-force login). Monitors compliance (PCI, HIPAA, SOC 2). Integrates with SIEM tools or your DevSecOps pipeline. Example: Detects an unusual volume of login attempts from a single IP. Automatically blocks it via an integrated firewall rule. CI/CD Pipeline Monitoring Use Case: Improve Build/Deploy Reliability Monitors builds, deploy times, failures, test coverage, and duration. Tracks deployments across environments and correlates them with performance regressions. Example: Deployment to prod causes latency spikes. Datadog tags traces/logs with that version, making rollback decision faster. Alerts & Notifications Use Case: Proactive Monitoring & Automated Response Create monitors for any metric, log pattern, or error. Supports anomaly detection and forecasting. Alerting via Slack, Teams, PagerDuty, Webhooks, Email, etc. Example: “Alert if HTTP 5xx rate > 1% for 5 mins” — Datadog auto-notifies the incident team. Custom Dashboards for Teams Use Case: Give Everyone the Insights They Need Devs: Debug traces, view live logs. Ops: View CPU, memory, and system alerts. Business: Track sales, active
Datadog is more than just a monitoring tool — it’s a full-stack observability platform that empowers developers, DevOps engineers, SREs, and even business teams to monitor, debug, optimize, and secure applications and infrastructure.
Here’s a breakdown of how Datadog supports different stages and areas of the development and operations lifecycle:
- Application Performance Monitoring (APM)
Use Case: Identify Slow Code & Optimize Bottlenecks
Tracks end-to-end performance of .NET Core, Java, Node.js, Python, and more.
Visualizes method-level execution time, external dependencies (DBs, APIs), and latency.
Provides service maps, flame graphs, and spans to isolate slow or failing areas.
Example: A POST /api/order/checkout request takes 5 seconds. APM shows 3.5 seconds are spent on a SQL join, helping the dev fix the DB query.
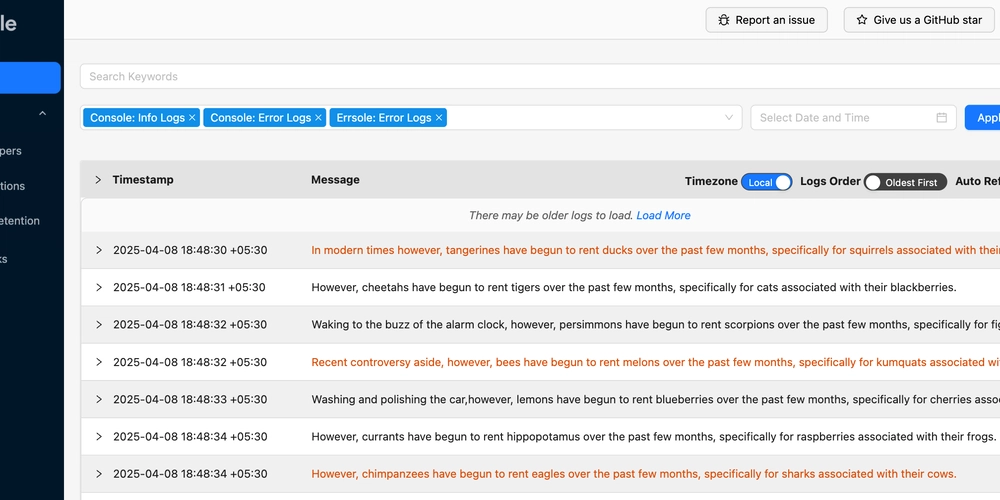
- Logs Management & Analysis
Use Case: Centralize, Search & Correlate Logs Across Services
Ingest logs from apps, servers, containers, firewalls, and more.
Supports parsing, filtering, tagging, and alerting on logs.
You can correlate logs with traces, helping pinpoint context fast.
Example: A user reports a payment failure. Devs search logs for their email, see the stack trace, and click into the corresponding trace to understand what broke.
- Real-Time Metrics Monitoring
Use Case: Monitor System Health & Custom Business Metrics
Tracks infrastructure (CPU, memory, I/O) and app-specific metrics.
Supports custom metrics via SDKs for .NET, Python, Java, etc.
Dashboards visualize real-time & historical data for fast decision-making.
Example: Developers track ItemsInCart.Count across time and regions to understand shopping trends or detect sudden drops.
- Distributed Tracing
Use Case: Debug Across Microservices & Understand Dependencies
See how a request flows through multiple services (microservices or serverless).
Understand timing and failures at each step.
Detect high-latency internal calls or timeout-prone external APIs.
Example: A request flows through Auth → User → Billing → Notification services. You spot a 2s delay in Billing caused by an overloaded Redis instance.
- Infrastructure Monitoring
Use Case: Visualize & Alert on Infrastructure in Cloud, Hybrid, or On-Prem
Automatically discovers EC2, Azure VMs, GCP instances, Kubernetes nodes, Docker containers, and more.
Provides live heatmaps, topology maps, and health overviews.
Tracks disk usage, open connections, network traffic, etc.
Example: A .NET app running in Azure AKS crashes intermittently. Datadog shows the node has disk pressure and evictions.
- Error Tracking
Use Case: Identify, Aggregate & Prioritize Production Errors
Tracks exceptions in your app: .NET, JavaScript, etc.
Groups them by stack trace and frequency.
Allows you to set alerts on new or high-volume errors.
Example: After a deployment, 300+ NullReferenceException logs spike. Datadog notifies the dev team instantly, and they roll back before users notice.
- Synthetic Monitoring
Use Case: Ensure Uptime & Measure End-User Experience
Automates browser or HTTP tests against APIs and websites.
Can simulate logins, form fills, and flows (e.g., checkout process).
Checks from multiple global locations for regional issues.
Example: Datadog detects a failed login flow at 2 AM via synthetics and alerts DevOps before users wake up.
- Real User Monitoring (RUM)
Use Case: Understand How Users Experience Your Frontend
Tracks page load time, JS errors, AJAX calls, and user sessions.
Detects slow assets or unhandled exceptions affecting UX.
Filters by browser, location, OS, user ID.
Example: Users on Safari 17.3 report lag. Datadog shows high Largest Contentful Paint (LCP) times for that browser only.
- Security Monitoring
Use Case: Detect Security Threats & Misconfigurations
Analyzes logs for suspicious activity (e.g., SQL injection attempts, brute-force login).
Monitors compliance (PCI, HIPAA, SOC 2).
Integrates with SIEM tools or your DevSecOps pipeline.
Example: Detects an unusual volume of login attempts from a single IP. Automatically blocks it via an integrated firewall rule.
- CI/CD Pipeline Monitoring
Use Case: Improve Build/Deploy Reliability
Monitors builds, deploy times, failures, test coverage, and duration.
Tracks deployments across environments and correlates them with performance regressions.
Example: Deployment to prod causes latency spikes. Datadog tags traces/logs with that version, making rollback decision faster.
- Alerts & Notifications
Use Case: Proactive Monitoring & Automated Response
Create monitors for any metric, log pattern, or error.
Supports anomaly detection and forecasting.
Alerting via Slack, Teams, PagerDuty, Webhooks, Email, etc.
Example: “Alert if HTTP 5xx rate > 1% for 5 mins” — Datadog auto-notifies the incident team.
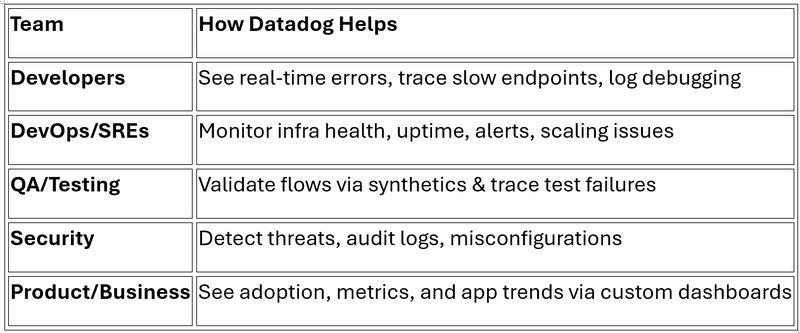
- Custom Dashboards for Teams
Use Case: Give Everyone the Insights They Need
Devs: Debug traces, view live logs.
Ops: View CPU, memory, and system alerts.
Business: Track sales, active users, or feature usage.
Security: Monitor unusual login attempts or audit trails.
Example: Product Managers view a dashboard tracking premium feature usage and correlate it with recent deploys.
Final Thoughts
Thank you for taking the time to read this. I hope you found these use cases helpful. Stay tuned for the next blog on integrating Datadog with a .NET application.**