


![[Webinar] AI Is Already Inside Your SaaS Stack — Learn How to Prevent the Next Silent Breach](https://blogger.googleusercontent.com/img/b/R29vZ2xl/AVvXsEiOWn65wd33dg2uO99NrtKbpYLfcepwOLidQDMls0HXKlA91k6HURluRA4WXgJRAZldEe1VReMQZyyYt1PgnoAn5JPpILsWlXIzmrBSs_TBoyPwO7hZrWouBg2-O3mdeoeSGY-l9_bsZB7vbpKjTSvG93zNytjxgTaMPqo9iq9Z5pGa05CJOs9uXpwHFT4/s1600/ai-cyber.jpg?#)


![[The AI Show Episode 144]: ChatGPT’s New Memory, Shopify CEO’s Leaked “AI First” Memo, Google Cloud Next Releases, o3 and o4-mini Coming Soon & Llama 4’s Rocky Launch](https://www.marketingaiinstitute.com/hubfs/ep%20144%20cover.png)


![Rogue Company Elite tier list of best characters [April 2025]](https://media.pocketgamer.com/artwork/na-33136-1657102075/rogue-company-ios-android-tier-cover.jpg?#)


_Andreas_Prott_Alamy.jpg?width=1280&auto=webp&quality=80&disable=upscale#)


![What’s new in Android’s April 2025 Google System Updates [U: 4/18]](https://i0.wp.com/9to5google.com/wp-content/uploads/sites/4/2025/01/google-play-services-3.jpg?resize=1200%2C628&quality=82&strip=all&ssl=1)


![Apple Watch Series 10 Back On Sale for $299! [Lowest Price Ever]](https://www.iclarified.com/images/news/96657/96657/96657-640.jpg)
![EU Postpones Apple App Store Fines Amid Tariff Negotiations [Report]](https://www.iclarified.com/images/news/97068/97068/97068-640.jpg)
![Apple Slips to Fifth in China's Smartphone Market with 9% Decline [Report]](https://www.iclarified.com/images/news/97065/97065/97065-640.jpg)


"Help! My Server is on Fire (Probably)" - A DevOps Engineer's Guide to Panic-Driven Statistics.
The Problem: Servers Behaving Badly You wake up at 3 AM to an alert: "CPU at 99%!" Your heart rate spikes. Is it a crypto miner? A runaway cron job? Did someone deploy to production on a Friday? Again? As a DevOps engineer, you need answers—fast. But logging into a server and running a dozen commands is exhausting. You need one magical script to tell you everything: How much CPU is melting? Why is memory disappearing like my motivation on Monday? Who filled up the disk? (Spoiler: It’s always logs.) So, I present to you: server-stats.sh—the Swiss Army knife of server diagnostics, wrapped in anxiety-reducing colors. Introducing server-stats.sh – Because Guessing is Not a Monitoring Strategy This script does everything you wish top and htop did, but without the weird keybindings you always forget. What It Tells You (Before You Have a Mental Breakdown) "Is the CPU on Fire?" Total CPU usage (so you know whether to panic now or in 5 minutes). "Why is Memory Gone?" Free vs. Used (with percentages, because math is hard at 3 AM). "Who Ate My Disk Space?" Lists disk usage (and turns red if it’s critical, just like your face when you see 95% usage). "Top 5 Processes Trying to Kill Your Server" CPU hogs (looking at you, Java). Memory vampires (probably Node.js with 500 open dependencies). Bonus: "Is Anyone Else Even Awake?" Shows logged-in users (so you know who to blame). Failed login attempts (because hackers love weekends too). The Script (AKA "The Hero We Need") #!/bin/bash # server-stats.sh - A comprehensive server performance statistics script # Color codes for output RED='\033[0;31m' GREEN='\033[0;32m' YELLOW='\033[0;33m' BLUE='\033[0;34m' MAGENTA='\033[0;35m' CYAN='\033[0;36m' NC='\033[0m' # No Color # Function to display section headers section_header() { echo -e "\n${MAGENTA}=== $1 ===${NC}" } # Function to convert bytes to human readable format human_readable() { local bytes=$1 local units=("B" "KB" "MB" "GB" "TB" "PB") local unit=0 while (( bytes > 1024 )) && (( unit < ${#units[@]} - 1 )); do bytes=$((bytes / 1024)) ((unit++)) done echo "$bytes ${units[$unit]}" } # Get OS information section_header "System Information" echo -e "${CYAN}Hostname:${NC} $(hostname)" echo -e "${CYAN}OS:${NC} $(grep PRETTY_NAME /etc/os-release | cut -d '"' -f 2)" echo -e "${CYAN}Kernel:${NC} $(uname -r)" echo -e "${CYAN}Uptime:${NC} $(uptime -p | sed 's/up //')" echo -e "${CYAN}Current Time:${NC} $(date)" # CPU Usage section_header "CPU Usage" total_cpu_usage=$(top -bn1 | grep "Cpu(s)" | sed "s/.*, *\([0-9.]*\)%* id.*/\1/" | awk '{print 100 - $1"%"}') echo -e "${CYAN}Total CPU Usage:${NC} $total_cpu_usage" load_avg=$(uptime | awk -F 'load average: ' '{print $2}') echo -e "${CYAN}Load Average (1, 5, 15 min):${NC} $load_avg" # Memory Usage section_header "Memory Usage" free_output=$(free -m) total_mem=$(echo "$free_output" | grep Mem: | awk '{print $2}') used_mem=$(echo "$free_output" | grep Mem: | awk '{print $3}') free_mem=$(echo "$free_output" | grep Mem: | awk '{print $4}') mem_percent=$((used_mem * 100 / total_mem)) echo -e "${CYAN}Total Memory:${NC} ${total_mem}MB" echo -e "${CYAN}Used Memory:${NC} ${used_mem}MB (${mem_percent}%)" echo -e "${CYAN}Free Memory:${NC} ${free_mem}MB" # Swap Usage swap_total=$(echo "$free_output" | grep Swap: | awk '{print $2}') swap_used=$(echo "$free_output" | grep Swap: | awk '{print $3}') if [ "$swap_total" -gt 0 ]; then swap_percent=$((swap_used * 100 / swap_total)) echo -e "${CYAN}Total Swap:${NC} ${swap_total}MB" echo -e "${CYAN}Used Swap:${NC} ${swap_used}MB (${swap_percent}%)" else echo -e "${CYAN}Swap:${NC} Not configured" fi # Disk Usage section_header "Disk Usage" df_output=$(df -h --total | grep -vE '^tmpfs|udev') echo "$df_output" | awk -v cyan="${CYAN}" -v nc="${NC}" -v green="${GREEN}" -v red="${RED}" ' NR==1 {printf "%s%-20s %s%-10s %s%-10s %s%-10s %s%-10s %s%s\n", cyan, "Filesystem", cyan, "Size", cyan, "Used", cyan, "Avail", cyan, "Use%", cyan, "Mounted on", nc} NR>1 && $1 != "total" { color=($5+0 > 80) ? red : green; printf "%-20s %-10s %-10s %-10s %s%-10s%s %-10s\n", $1, $2, $3, $4, color, $5, nc, $6 } $1 == "total" { printf "%s%-20s %s%-10s %s%-10s %s%-10s %s%-10s %s%s\n", cyan, $1, cyan, $2, cyan, $3, cyan, $4, cyan, $5, cyan, $6, nc }' # Top Processes by CPU section_header "Top 5 Processes by CPU Usage" echo -e "${CYAN}%-10s %-10s %-10s %-10s %s${NC}" "PID" "USER" "CPU%" "MEM%" "COMMAND" ps -eo pid,user,%cpu,%mem,comm --sort=-%cpu | head -n 6 | tail -n 5 | awk '{printf "%-10s %-10s %-10s %-10s %s\n", $1, $2, $3, $4, $5}' # Top Processes by Memory section_header "Top 5 Processes by Memory Usage" echo -e "${CYAN}%-10s %-10s %-10s %-10s %s${NC}" "PID" "USER" "MEM%" "CPU%" "COMMAND" ps -eo pid,user,%mem,%cpu,comm --sort=-%mem | head -n 6 | tail -n 5 | awk '{printf "%-10s %-10s %-10s %-10s %s\n", $1, $2, $3, $4, $5
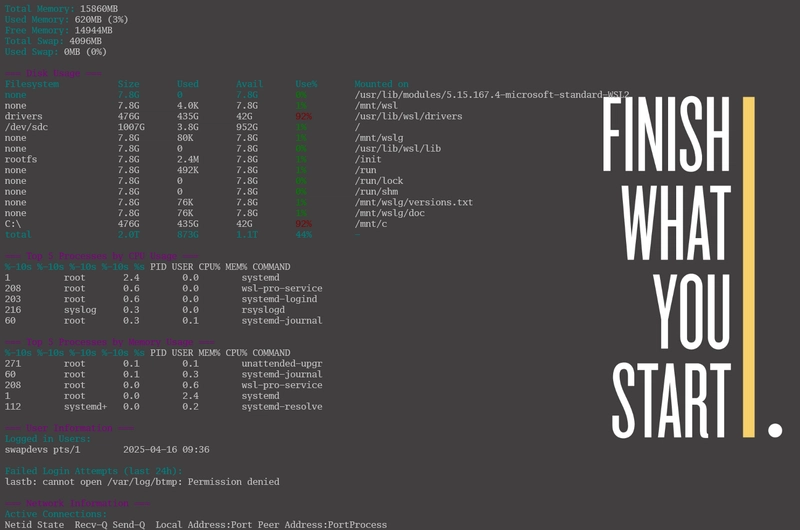
The Problem: Servers Behaving Badly
You wake up at 3 AM to an alert: "CPU at 99%!" Your heart rate spikes. Is it a crypto miner? A runaway cron job? Did someone deploy to production on a Friday? Again?
As a DevOps engineer, you need answers—fast. But logging into a server and running a dozen commands is exhausting. You need one magical script to tell you everything:
- How much CPU is melting?
- Why is memory disappearing like my motivation on Monday?
- Who filled up the disk? (Spoiler: It’s always logs.)
So, I present to you: server-stats.sh—the Swiss Army knife of server diagnostics, wrapped in anxiety-reducing colors.
Introducing server-stats.sh – Because Guessing is Not a Monitoring Strategy
This script does everything you wish top and htop did, but without the weird keybindings you always forget.
What It Tells You (Before You Have a Mental Breakdown)
"Is the CPU on Fire?"
- Total CPU usage (so you know whether to panic now or in 5 minutes).
"Why is Memory Gone?"
- Free vs. Used (with percentages, because math is hard at 3 AM).
"Who Ate My Disk Space?"
- Lists disk usage (and turns red if it’s critical, just like your face when you see 95% usage).
"Top 5 Processes Trying to Kill Your Server"
- CPU hogs (looking at you, Java).
- Memory vampires (probably Node.js with 500 open dependencies).
Bonus: "Is Anyone Else Even Awake?"
- Shows logged-in users (so you know who to blame).
- Failed login attempts (because hackers love weekends too).
The Script (AKA "The Hero We Need")
#!/bin/bash

# server-stats.sh - A comprehensive server performance statistics script

# Color codes for output
RED='\033[0;31m'
GREEN='\033[0;32m'
YELLOW='\033[0;33m'
BLUE='\033[0;34m'
MAGENTA='\033[0;35m'
CYAN='\033[0;36m'
NC='\033[0m' # No Color

# Function to display section headers
section_header() {
    echo -e "\n${MAGENTA}=== $1 ===${NC}"
}

# Function to convert bytes to human readable format
human_readable() {
    local bytes=$1
    local units=("B" "KB" "MB" "GB" "TB" "PB")
    local unit=0

    while (( bytes > 1024 )) && (( unit < ${#units[@]} - 1 )); do
        bytes=$((bytes / 1024))
        ((unit++))
    done

    echo "$bytes ${units[$unit]}"
}

# Get OS information
section_header "System Information"
echo -e "${CYAN}Hostname:${NC} $(hostname)"
echo -e "${CYAN}OS:${NC} $(grep PRETTY_NAME /etc/os-release | cut -d '"' -f 2)"
echo -e "${CYAN}Kernel:${NC} $(uname -r)"
echo -e "${CYAN}Uptime:${NC} $(uptime -p | sed 's/up //')"
echo -e "${CYAN}Current Time:${NC} $(date)"

# CPU Usage
section_header "CPU Usage"
total_cpu_usage=$(top -bn1 | grep "Cpu(s)" | sed "s/.*, *\([0-9.]*\)%* id.*/\1/" | awk '{print 100 - $1"%"}')
echo -e "${CYAN}Total CPU Usage:${NC} $total_cpu_usage"
load_avg=$(uptime | awk -F 'load average: ' '{print $2}')
echo -e "${CYAN}Load Average (1, 5, 15 min):${NC} $load_avg"

# Memory Usage
section_header "Memory Usage"
free_output=$(free -m)
total_mem=$(echo "$free_output" | grep Mem: | awk '{print $2}')
used_mem=$(echo "$free_output" | grep Mem: | awk '{print $3}')
free_mem=$(echo "$free_output" | grep Mem: | awk '{print $4}')
mem_percent=$((used_mem * 100 / total_mem))

echo -e "${CYAN}Total Memory:${NC} ${total_mem}MB"
echo -e "${CYAN}Used Memory:${NC} ${used_mem}MB (${mem_percent}%)"
echo -e "${CYAN}Free Memory:${NC} ${free_mem}MB"

# Swap Usage
swap_total=$(echo "$free_output" | grep Swap: | awk '{print $2}')
swap_used=$(echo "$free_output" | grep Swap: | awk '{print $3}')
if [ "$swap_total" -gt 0 ]; then
    swap_percent=$((swap_used * 100 / swap_total))
    echo -e "${CYAN}Total Swap:${NC} ${swap_total}MB"
    echo -e "${CYAN}Used Swap:${NC} ${swap_used}MB (${swap_percent}%)"
else
    echo -e "${CYAN}Swap:${NC} Not configured"
fi

# Disk Usage
section_header "Disk Usage"
df_output=$(df -h --total | grep -vE '^tmpfs|udev')
echo "$df_output" | awk -v cyan="${CYAN}" -v nc="${NC}" -v green="${GREEN}" -v red="${RED}" '
    NR==1 {printf "%s%-20s %s%-10s %s%-10s %s%-10s %s%-10s %s%s\n", cyan, "Filesystem", cyan, "Size", cyan, "Used", cyan, "Avail", cyan, "Use%", cyan, "Mounted on", nc}
    NR>1 && $1 != "total" {
        color=($5+0 > 80) ? red : green;
        printf "%-20s %-10s %-10s %-10s %s%-10s%s %-10s\n", $1, $2, $3, $4, color, $5, nc, $6
    }
    $1 == "total" {
        printf "%s%-20s %s%-10s %s%-10s %s%-10s %s%-10s %s%s\n", cyan, $1, cyan, $2, cyan, $3, cyan, $4, cyan, $5, cyan, $6, nc
    }'

# Top Processes by CPU
section_header "Top 5 Processes by CPU Usage"
echo -e "${CYAN}%-10s %-10s %-10s %-10s %s${NC}" "PID" "USER" "CPU%" "MEM%" "COMMAND"
ps -eo pid,user,%cpu,%mem,comm --sort=-%cpu | head -n 6 | tail -n 5 | awk '{printf "%-10s %-10s %-10s %-10s %s\n", $1, $2, $3, $4, $5}'

# Top Processes by Memory
section_header "Top 5 Processes by Memory Usage"
echo -e "${CYAN}%-10s %-10s %-10s %-10s %s${NC}" "PID" "USER" "MEM%" "CPU%" "COMMAND"
ps -eo pid,user,%mem,%cpu,comm --sort=-%mem | head -n 6 | tail -n 5 | awk '{printf "%-10s %-10s %-10s %-10s %s\n", $1, $2, $3, $4, $5}'

# User Information
section_header "User Information"
echo -e "${CYAN}Logged in Users:${NC}"
who
echo -e "\n${CYAN}Failed Login Attempts (last 24h):${NC}"
lastb -a --time-format iso | head -n 10

# Network Information
section_header "Network Information"
echo -e "${CYAN}Active Connections:${NC}"
ss -tulnp | head -n 10

# Security Information
section_header "Security Information"
echo -e "${CYAN}Last 10 Security Events:${NC}"
grep -i 'error\|fail\|denied' /var/log/auth.log | tail -n 10 2>/dev/null || echo "No security logs found or permission denied"

echo -e "\n${GREEN}Server stats collected successfully!${NC}"
How to Use This Script (Before You Cry)
- Save it as server-stats.sh
nano server-stats.sh # Paste the script, then [Ctrl]+[X], [Y], [Enter]
Make it executable (because permissions are annoying)
chmod +x server-stats.shRun it when you suspect disaster
./server-stats.shInterpret the results
Green = "Maybe I can go back to bed?"
Yellow = "I should check this… later."
Red = "Wake up the team (and maybe a therapist)."
Final Thoughts
Servers are like pets—they misbehave when you least expect it. But with server-stats.sh, you can:
✅ Diagnose problems in seconds (instead of Googling htop commands).
✅ Blame the right processes (looking at you, apache2).
✅ Pretend you’re a hacker (even though you just ran a Bash script).
So next time your server acts up, stay calm, run the script, and panic efficiently.