


![[The AI Show Episode 142]: ChatGPT’s New Image Generator, Studio Ghibli Craze and Backlash, Gemini 2.5, OpenAI Academy, 4o Updates, Vibe Marketing & xAI Acquires X](https://www.marketingaiinstitute.com/hubfs/ep%20142%20cover.png)


![From drop-out to software architect with Jason Lengstorf [Podcast #167]](https://cdn.hashnode.com/res/hashnode/image/upload/v1743796461357/f3d19cd7-e6f5-4d7c-8bfc-eb974bc8da68.png?#)


.png?#)


_Christophe_Coat_Alamy.jpg?#)
 (1).webp?#)


![Apple Considers Delaying Smart Home Hub Until 2026 [Gurman]](https://www.iclarified.com/images/news/96946/96946/96946-640.jpg)
![iPhone 17 Pro Won't Feature Two-Toned Back [Gurman]](https://www.iclarified.com/images/news/96944/96944/96944-640.jpg)
![Tariffs Threaten Apple's $999 iPhone Price Point in the U.S. [Gurman]](https://www.iclarified.com/images/news/96943/96943/96943-640.jpg)


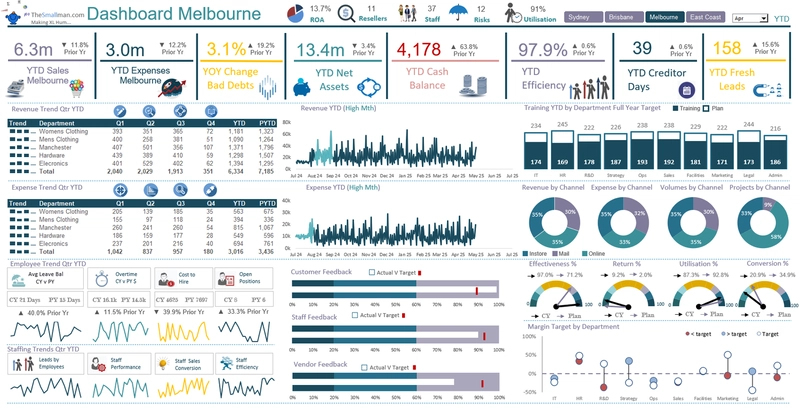
DATA ANALYSIS AND DASHBOARDING IN EXCEL
DATA ANALYSIS Google defines data analysis as the process of inspecting, cleansing, transforming, and modeling data to discover useful information, informing conclusions, and supporting decision-making. Data in itself is raw uncleaned information, data analysis is therefore the process of cleaning data to come up with clear and concise information that is easy to understand and digest. Data analysis aims to answer the questions of what happened, why it happened, and what will happen(in the future) using data. It also seeks to come up with probable solutions based on data to aid in decision-making. EXCEL Excel is a powerful analysis tool designed by Microsoft. It provides features that enable entry, processing, data management, project and business management, and task automation. It has tools suitable for researchers and business analysts to use for data cleaning, analysis, and manipulation. The beauty of using Excel is that it doesn't require a lot of technical training or expertise to use. All features of Excel are clearly defined and well illustrated enhancing user experience and increasing productivity. DASHBOARDING IN EXCEL Dashboarding is the process of designing visually appealing dashboards used to make presentations and to also provide reports of collected data to stakeholders, potential investors, and prospective clients without the hassle of having them go through endless rows and columns of an Excel worksheet. Dashboarding makes communication between stakeholders easy, smooth, and efficient while also saving time by creating visualizations based on the most important metrics of the data that aid decision-making. Pivot tables are an Excel feature that plays a major role in the creation of dashboards. It is an easy way to build and summarize reports.
DATA ANALYSIS
Google defines data analysis as the process of inspecting, cleansing, transforming, and modeling data to discover useful information, informing conclusions, and supporting decision-making.
Data in itself is raw uncleaned information, data analysis is therefore the process of cleaning data to come up with clear and concise information that is easy to understand and digest.
Data analysis aims to answer the questions of what happened, why it happened, and what will happen(in the future) using data. It also seeks to come up with probable solutions based on data to aid in decision-making.
EXCEL
Excel is a powerful analysis tool designed by Microsoft. It provides features that enable entry, processing, data management, project and business management, and task automation. It has tools suitable for researchers and business analysts to use for data cleaning, analysis, and manipulation.
The beauty of using Excel is that it doesn't require a lot of technical training or expertise to use. All features of Excel are clearly defined and well illustrated enhancing user experience and increasing productivity.
DASHBOARDING IN EXCEL
Dashboarding is the process of designing visually appealing dashboards used to make presentations and to also provide reports of collected data to stakeholders, potential investors, and prospective clients without the hassle of having them go through endless rows and columns of an Excel worksheet.
Dashboarding makes communication between stakeholders easy, smooth, and efficient while also saving time by creating visualizations based on the most important metrics of the data that aid decision-making.
Pivot tables are an Excel feature that plays a major role in the creation of dashboards. It is an easy way to build and summarize reports.