.jpg)


![[Webinar] AI Is Already Inside Your SaaS Stack — Learn How to Prevent the Next Silent Breach](https://blogger.googleusercontent.com/img/b/R29vZ2xl/AVvXsEiOWn65wd33dg2uO99NrtKbpYLfcepwOLidQDMls0HXKlA91k6HURluRA4WXgJRAZldEe1VReMQZyyYt1PgnoAn5JPpILsWlXIzmrBSs_TBoyPwO7hZrWouBg2-O3mdeoeSGY-l9_bsZB7vbpKjTSvG93zNytjxgTaMPqo9iq9Z5pGa05CJOs9uXpwHFT4/s1600/ai-cyber.jpg?#)


![[The AI Show Episode 144]: ChatGPT’s New Memory, Shopify CEO’s Leaked “AI First” Memo, Google Cloud Next Releases, o3 and o4-mini Coming Soon & Llama 4’s Rocky Launch](https://www.marketingaiinstitute.com/hubfs/ep%20144%20cover.png)


![Rogue Company Elite tier list of best characters [April 2025]](https://media.pocketgamer.com/artwork/na-33136-1657102075/rogue-company-ios-android-tier-cover.jpg?#)


_Andreas_Prott_Alamy.jpg?width=1280&auto=webp&quality=80&disable=upscale#)


![What’s new in Android’s April 2025 Google System Updates [U: 4/18]](https://i0.wp.com/9to5google.com/wp-content/uploads/sites/4/2025/01/google-play-services-3.jpg?resize=1200%2C628&quality=82&strip=all&ssl=1)


![Apple Watch Series 10 Back On Sale for $299! [Lowest Price Ever]](https://www.iclarified.com/images/news/96657/96657/96657-640.jpg)
![EU Postpones Apple App Store Fines Amid Tariff Negotiations [Report]](https://www.iclarified.com/images/news/97068/97068/97068-640.jpg)
![Apple Slips to Fifth in China's Smartphone Market with 9% Decline [Report]](https://www.iclarified.com/images/news/97065/97065/97065-640.jpg)


Crafting Killer Accuracy Metrics for AI Apps
Evaluating AI apps can be a puzzle, but accuracy metrics are your key to understanding how well your model performs. Whether you’re building a chatbot, image classifier, or API extractor, metrics show you what’s working and what needs fixing. This guide dives into creating accuracy metrics, focusing on an AI that extracts API endpoints from a spec. Fishing for APIs: A Simple Analogy Consider the case of an AI app such as LiveAPI - which reads code repositories and produces API documentation. Imagine for a moment that you're building something like this. Picture your AI as a fishing net in a pond filled with fish (real API endpoints) and debris (non-endpoints or hallucinations). Your goal is to catch all the fish and avoid the debris. Here’s how it breaks down: Analogy Term AI Metric Meaning Fish in net True Positives (TP) Correctly caught real endpoints. Debris in net False Positives (FP) Wrongly flagged non-endpoints as endpoints. Fish still swimming False Negatives (FN) Missed real endpoints. No catch (just water) True Negatives (TN) Correctly ignored non-endpoints. A fine-mesh net grabs more fish (higher recall) but also more debris (lower precision). A coarse-mesh net catches less debris (higher precision) but lets fish escape (lower recall). Tuning your AI is like adjusting the net’s mesh to balance these outcomes. Visualizing Metrics Consider a pond that consists of 10 fish and 6 garbage bags: We put a net with the explicit goal of "Catch all fish, while avoiding all garbage bags". That is the ideal goal we have, but in practice we may get something like this: Let's get a count of results and introduce some technical words (we'll learn this in detail later): A slogan to keep in mind with the vocabulary here is "True means Right Judgement" or "True means Correct Judgement". It can also be read as "True means Good or Helpful judgement". That is what we want more of. We want bad matches, bad judgement to be minimized by the net: Once we have the numbers - we can put it in a kind of "confusion matrix" as follows. It tells us numbers for True/Correct/Expected results (green) and also for False/Wrong/Unexpected results (red): Or - in regards to our original goal - we can visualize it this way: Metrics in Action: Real-World Examples Let’s see metrics at work with our API extractor. Imagine processing an OpenAPI spec with 100 lines, 30 of which are endpoints. Your AI flags 25 lines as endpoints, yielding: True Positives (TP): 20 real endpoints correctly flagged. False Positives (FP): 5 non-endpoints wrongly flagged. False Negatives (FN): 10 real endpoints missed. True Negatives (TN): 65 non-endpoints correctly ignored. Calculate the metrics: Precision: TP / (TP + FP) = 20 / (20 + 5) = 0.8 (80% of flagged endpoints are real). Recall: TP / (TP + FN) = 20 / (20 + 10) = 0.67 (caught 67% of real endpoints). F1-Score: 2 * (Precision * Recall) / (Precision + Recall) = 2 * (0.8 * 0.67) / (0.8 + 0.67) ≈ 0.73. Here’s a Python snippet to compute these: from sklearn.metrics import precision_score, recall_score, f1_score y_true = [1] * 20 + [0] * 5 + [1] * 10 + [0] * 65 # Actual labels y_pred = [1] * 20 + [1] * 5 + [0] * 10 + [0] * 65 # AI predictions precision = precision_score(y_true, y_pred) recall = recall_score(y_true, y_pred) f1 = f1_score(y_true, y_pred) print(f"Precision: {precision:.2f}, Recall: {recall:.2f}, F1: {f1:.2f}") Another scenario: Tweaking the AI to be stricter gives 15 TP, 2 FP, and 15 FN. Precision rises to 0.88, but recall drops to 0.5, showing the trade-off. What Metrics Really Mean Metrics are your AI’s scorecard, answering two key questions: How often is my AI right when it flags something? Precision tells you how many flagged “endpoints” are actually endpoints. How many real targets did my AI catch? Recall shows how many actual endpoints were found. For the API extractor: High precision means you trust the flagged endpoints, but you might miss some real ones. High recall means you’re catching most endpoints, even if some fake ones sneak in. The F1-score combines both into a single number for balance. You might also check accuracy (overall correctness) or AUC-ROC (how well your AI separates endpoints from non-endpoints), but precision and recall are the core. Low precision (e.g., 0.6) means too much junk is flagged. Low recall (e.g., 0.4) means missing endpoints. These numbers help you tweak your model or dataset. Building and Testing Metrics: The Technical Side Let’s get into the nitty-gritty of creating metrics. You need a labeled dataset—inputs with known correct outputs. For the API extractor, this is an API spec with lines tagged as “endpoint” or “non-endpoint.” Define the Goal The goal is to extract all valid API endpoints and avoid hallucinations. This points to metrics like precision, recall, and F1-score: Precision = TP / (TP + FP) Re
Evaluating AI apps can be a puzzle, but accuracy metrics are your key to understanding how well your model performs.
Whether you’re building a chatbot, image classifier, or API extractor, metrics show you what’s working and what needs fixing.
This guide dives into creating accuracy metrics, focusing on an AI that extracts API endpoints from a spec.
Fishing for APIs: A Simple Analogy
Consider the case of an AI app such as LiveAPI - which reads code repositories and produces API documentation. Imagine for a moment that you're building something like this.
Picture your AI as a fishing net in a pond filled with fish (real API endpoints) and debris (non-endpoints or hallucinations). Your goal is to catch all the fish and avoid the debris. Here’s how it breaks down:
| Analogy Term | AI Metric | Meaning |
|---|---|---|
| Fish in net | True Positives (TP) | Correctly caught real endpoints. |
| Debris in net | False Positives (FP) | Wrongly flagged non-endpoints as endpoints. |
| Fish still swimming | False Negatives (FN) | Missed real endpoints. |
| No catch (just water) | True Negatives (TN) | Correctly ignored non-endpoints. |
A fine-mesh net grabs more fish (higher recall) but also more debris (lower precision). A coarse-mesh net catches less debris (higher precision) but lets fish escape (lower recall). Tuning your AI is like adjusting the net’s mesh to balance these outcomes.
Visualizing Metrics
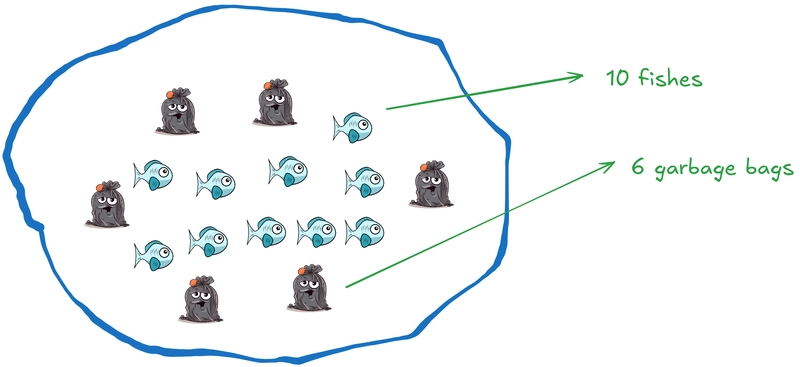
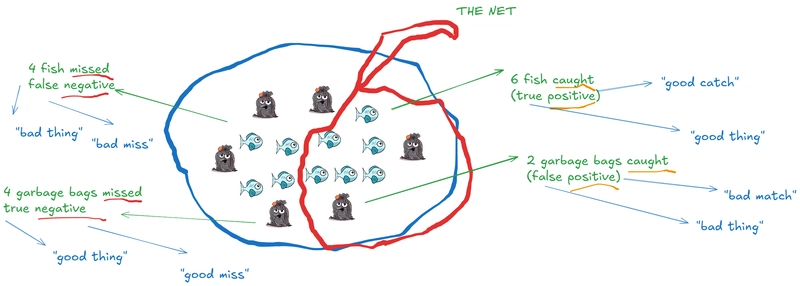
Consider a pond that consists of 10 fish and 6 garbage bags:
We put a net with the explicit goal of "Catch all fish, while avoiding all garbage bags". That is the ideal goal we have, but in practice we may get something like this:

Let's get a count of results and introduce some technical words (we'll learn this in detail later):
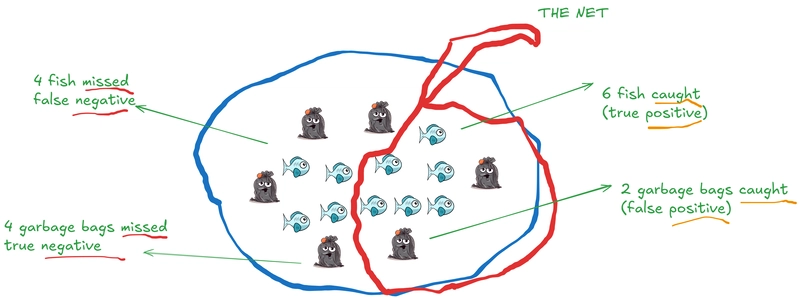
A slogan to keep in mind with the vocabulary here is "True means Right Judgement" or "True means Correct Judgement". It can also be read as "True means Good or Helpful judgement". That is what we want more of. We want bad matches, bad judgement to be minimized by the net:
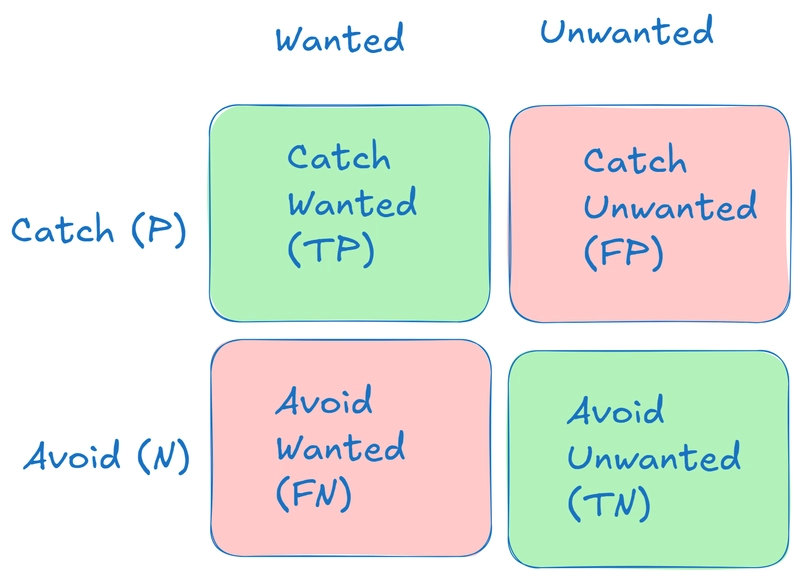
Once we have the numbers - we can put it in a kind of "confusion matrix" as follows. It tells us numbers for True/Correct/Expected results (green) and also for False/Wrong/Unexpected results (red):
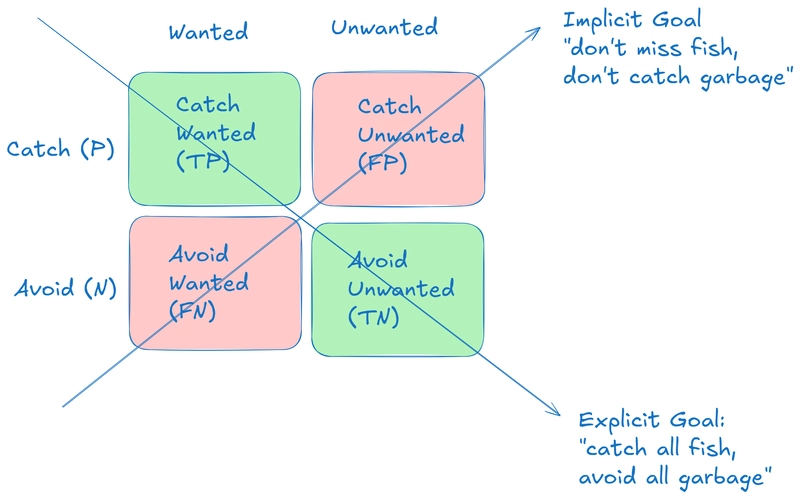
Or - in regards to our original goal - we can visualize it this way:
Metrics in Action: Real-World Examples
Let’s see metrics at work with our API extractor. Imagine processing an OpenAPI spec with 100 lines, 30 of which are endpoints. Your AI flags 25 lines as endpoints, yielding:
- True Positives (TP): 20 real endpoints correctly flagged.
- False Positives (FP): 5 non-endpoints wrongly flagged.
- False Negatives (FN): 10 real endpoints missed.
- True Negatives (TN): 65 non-endpoints correctly ignored.
Calculate the metrics:
- Precision: TP / (TP + FP) = 20 / (20 + 5) = 0.8 (80% of flagged endpoints are real).
- Recall: TP / (TP + FN) = 20 / (20 + 10) = 0.67 (caught 67% of real endpoints).
- F1-Score: 2 * (Precision * Recall) / (Precision + Recall) = 2 * (0.8 * 0.67) / (0.8 + 0.67) ≈ 0.73.
Here’s a Python snippet to compute these:
from sklearn.metrics import precision_score, recall_score, f1_score

y_true = [1] * 20 + [0] * 5 + [1] * 10 + [0] * 65  # Actual labels
y_pred = [1] * 20 + [1] * 5 + [0] * 10 + [0] * 65  # AI predictions

precision = precision_score(y_true, y_pred)
recall = recall_score(y_true, y_pred)
f1 = f1_score(y_true, y_pred)

print(f"Precision: {precision:.2f}, Recall: {recall:.2f}, F1: {f1:.2f}")
Another scenario: Tweaking the AI to be stricter gives 15 TP, 2 FP, and 15 FN. Precision rises to 0.88, but recall drops to 0.5, showing the trade-off.
What Metrics Really Mean
Metrics are your AI’s scorecard, answering two key questions:
- How often is my AI right when it flags something? Precision tells you how many flagged “endpoints” are actually endpoints.
- How many real targets did my AI catch? Recall shows how many actual endpoints were found.
For the API extractor:
- High precision means you trust the flagged endpoints, but you might miss some real ones.
- High recall means you’re catching most endpoints, even if some fake ones sneak in.
The F1-score combines both into a single number for balance. You might also check accuracy (overall correctness) or AUC-ROC (how well your AI separates endpoints from non-endpoints), but precision and recall are the core.
Low precision (e.g., 0.6) means too much junk is flagged. Low recall (e.g., 0.4) means missing endpoints. These numbers help you tweak your model or dataset.
Building and Testing Metrics: The Technical Side
Let’s get into the nitty-gritty of creating metrics. You need a labeled dataset—inputs with known correct outputs. For the API extractor, this is an API spec with lines tagged as “endpoint” or “non-endpoint.”
Define the Goal
The goal is to extract all valid API endpoints and avoid hallucinations. This points to metrics like precision, recall, and F1-score:
- Precision = TP / (TP + FP)
- Recall = TP / (TP + FN)
- F1 = 2 * (Precision * Recall) / (Precision + Recall)
Set Up a Test Set
Split your dataset into training (80%) and testing (20%). For a 200-line spec with 50 endpoints:
- Test set: 40 lines (10 endpoints, 30 non-endpoints).
- Run your AI on the test set to get predictions.
Compute Metrics
Use scikit-learn for calculations. Here’s an example:
from sklearn.model_selection import train_test_split
from sklearn.metrics import classification_report
import pandas as pd

# Load dataset
data = pd.read_csv('api_spec.csv')  # Columns: 'text', 'is_endpoint'
X, y = data['text'], data['is_endpoint']

# Split data
X_train, X_test, y_train, y_test = train_test_split(X, y, test_size=0.2, random_state=42)

# Assume your_model is trained
y_pred = your_model.predict(X_test)

# Print metrics
print(classification_report(y_test, y_pred))
Handle Trade-offs
Precision and recall often pull in opposite directions:
- Strict model: High precision (0.9), low recall (0.5). Use when fake endpoints are costly.
- Loose model: High recall (0.9), low precision (0.6). Use when missing endpoints is worse.
Avoid Pitfalls
- Imbalanced data: If 90% of lines are non-endpoints, high accuracy might mean predicting “no” all the time. Use F1-score.
- Metric obsession: Chasing high precision can tank recall. Monitor multiple metrics.
- Context matters: If fake endpoints break your app, prioritize precision.
Other Metrics
- Accuracy: (TP + TN) / (TP + TN + FP + FN). Misleading with imbalanced data.
- AUC-ROC: Measures class separation. Good for threshold tuning.
- mAP: Useful for tasks like object detection, less relevant here.
For more, check scikit-learn’s model evaluation docs.
This guide equips you to craft accuracy metrics for your AI apps. Use the fishing analogy to understand the problem, add your diagrams, test with examples, and apply the technical steps. Got questions or ideas about how to understand metrics better? Drop them in the comments!