


![[The AI Show Episode 142]: ChatGPT’s New Image Generator, Studio Ghibli Craze and Backlash, Gemini 2.5, OpenAI Academy, 4o Updates, Vibe Marketing & xAI Acquires X](https://www.marketingaiinstitute.com/hubfs/ep%20142%20cover.png)


![From drop-out to software architect with Jason Lengstorf [Podcast #167]](https://cdn.hashnode.com/res/hashnode/image/upload/v1743796461357/f3d19cd7-e6f5-4d7c-8bfc-eb974bc8da68.png?#)


.png?#)


_Christophe_Coat_Alamy.jpg?#)
 (1).webp?#)


![iPhone 17 Pro Won't Feature Two-Toned Back [Gurman]](https://www.iclarified.com/images/news/96944/96944/96944-640.jpg)
![Tariffs Threaten Apple's $999 iPhone Price Point in the U.S. [Gurman]](https://www.iclarified.com/images/news/96943/96943/96943-640.jpg)


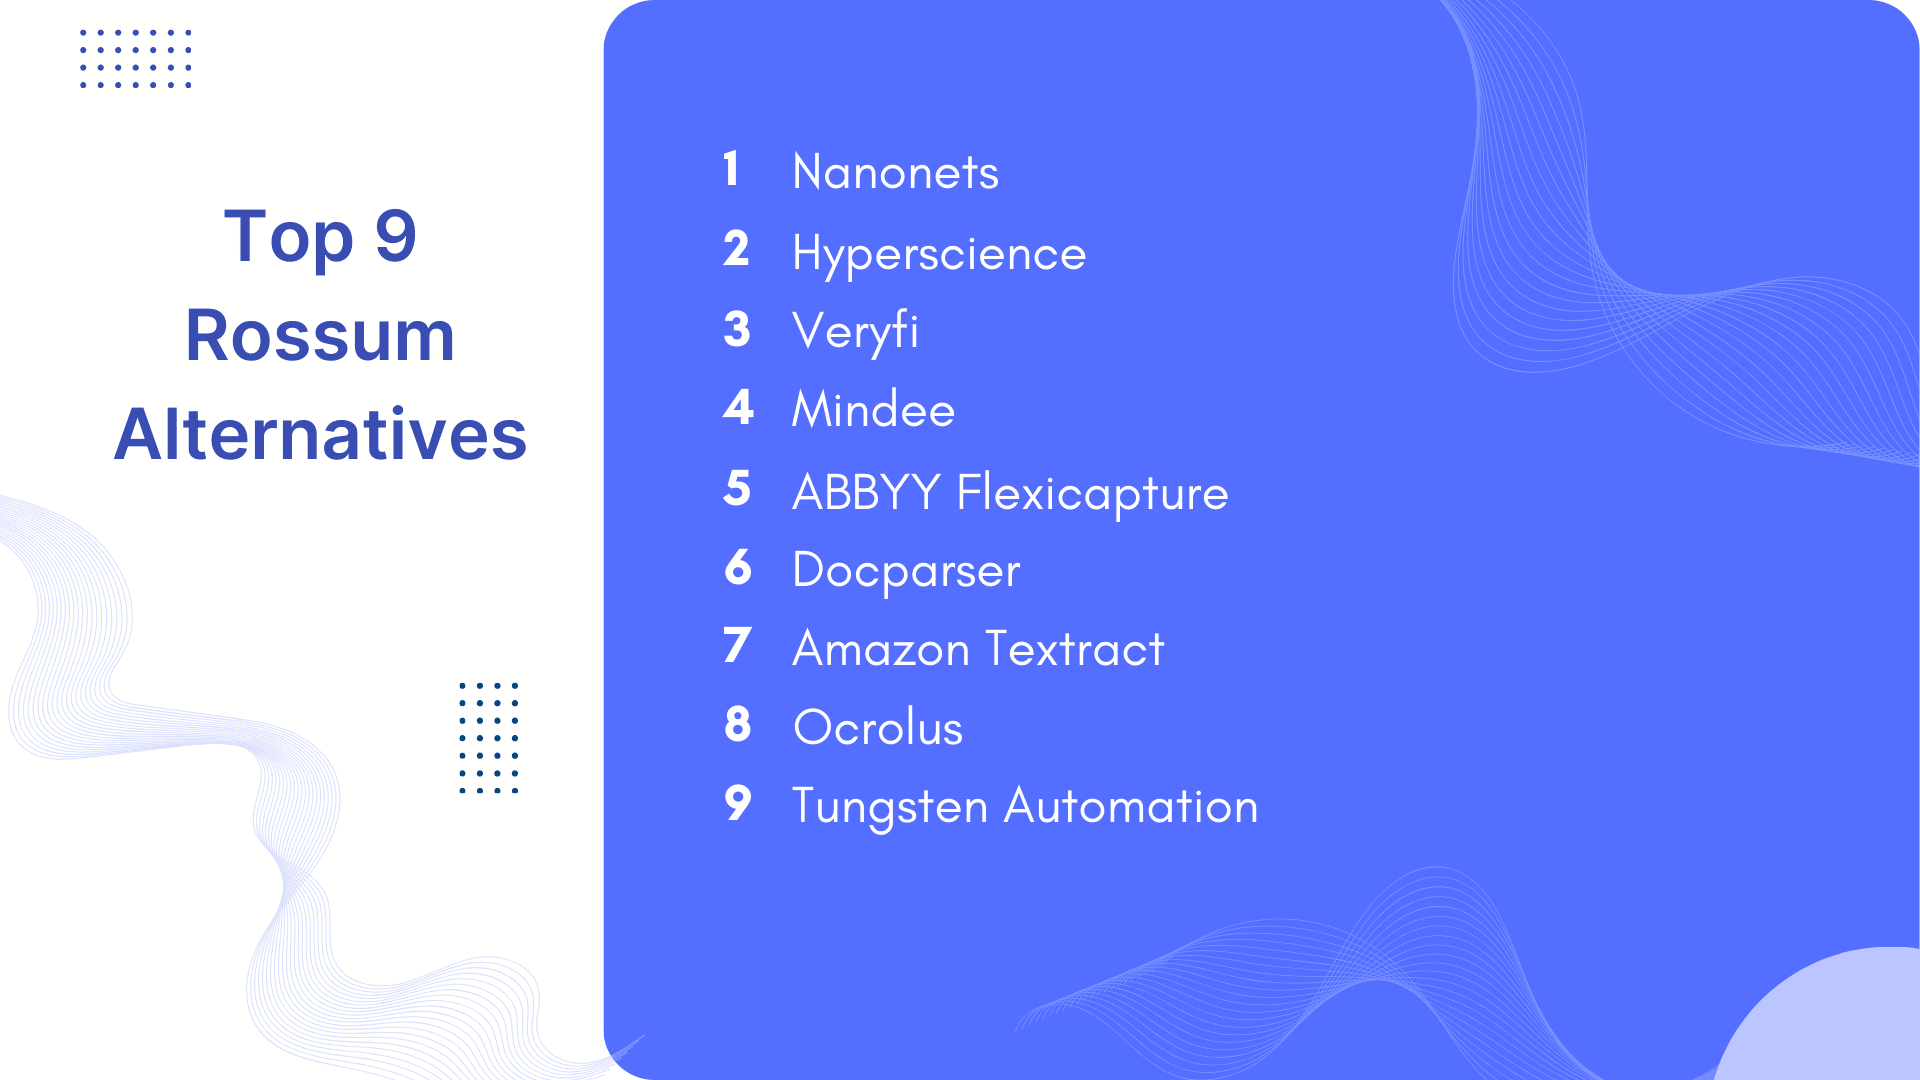
MASTERING SQL FOR DATA ENGINEERING: ADVANCED QUERIES, OPTIMIZATION AND DATA MODELLING BEST PRATICES
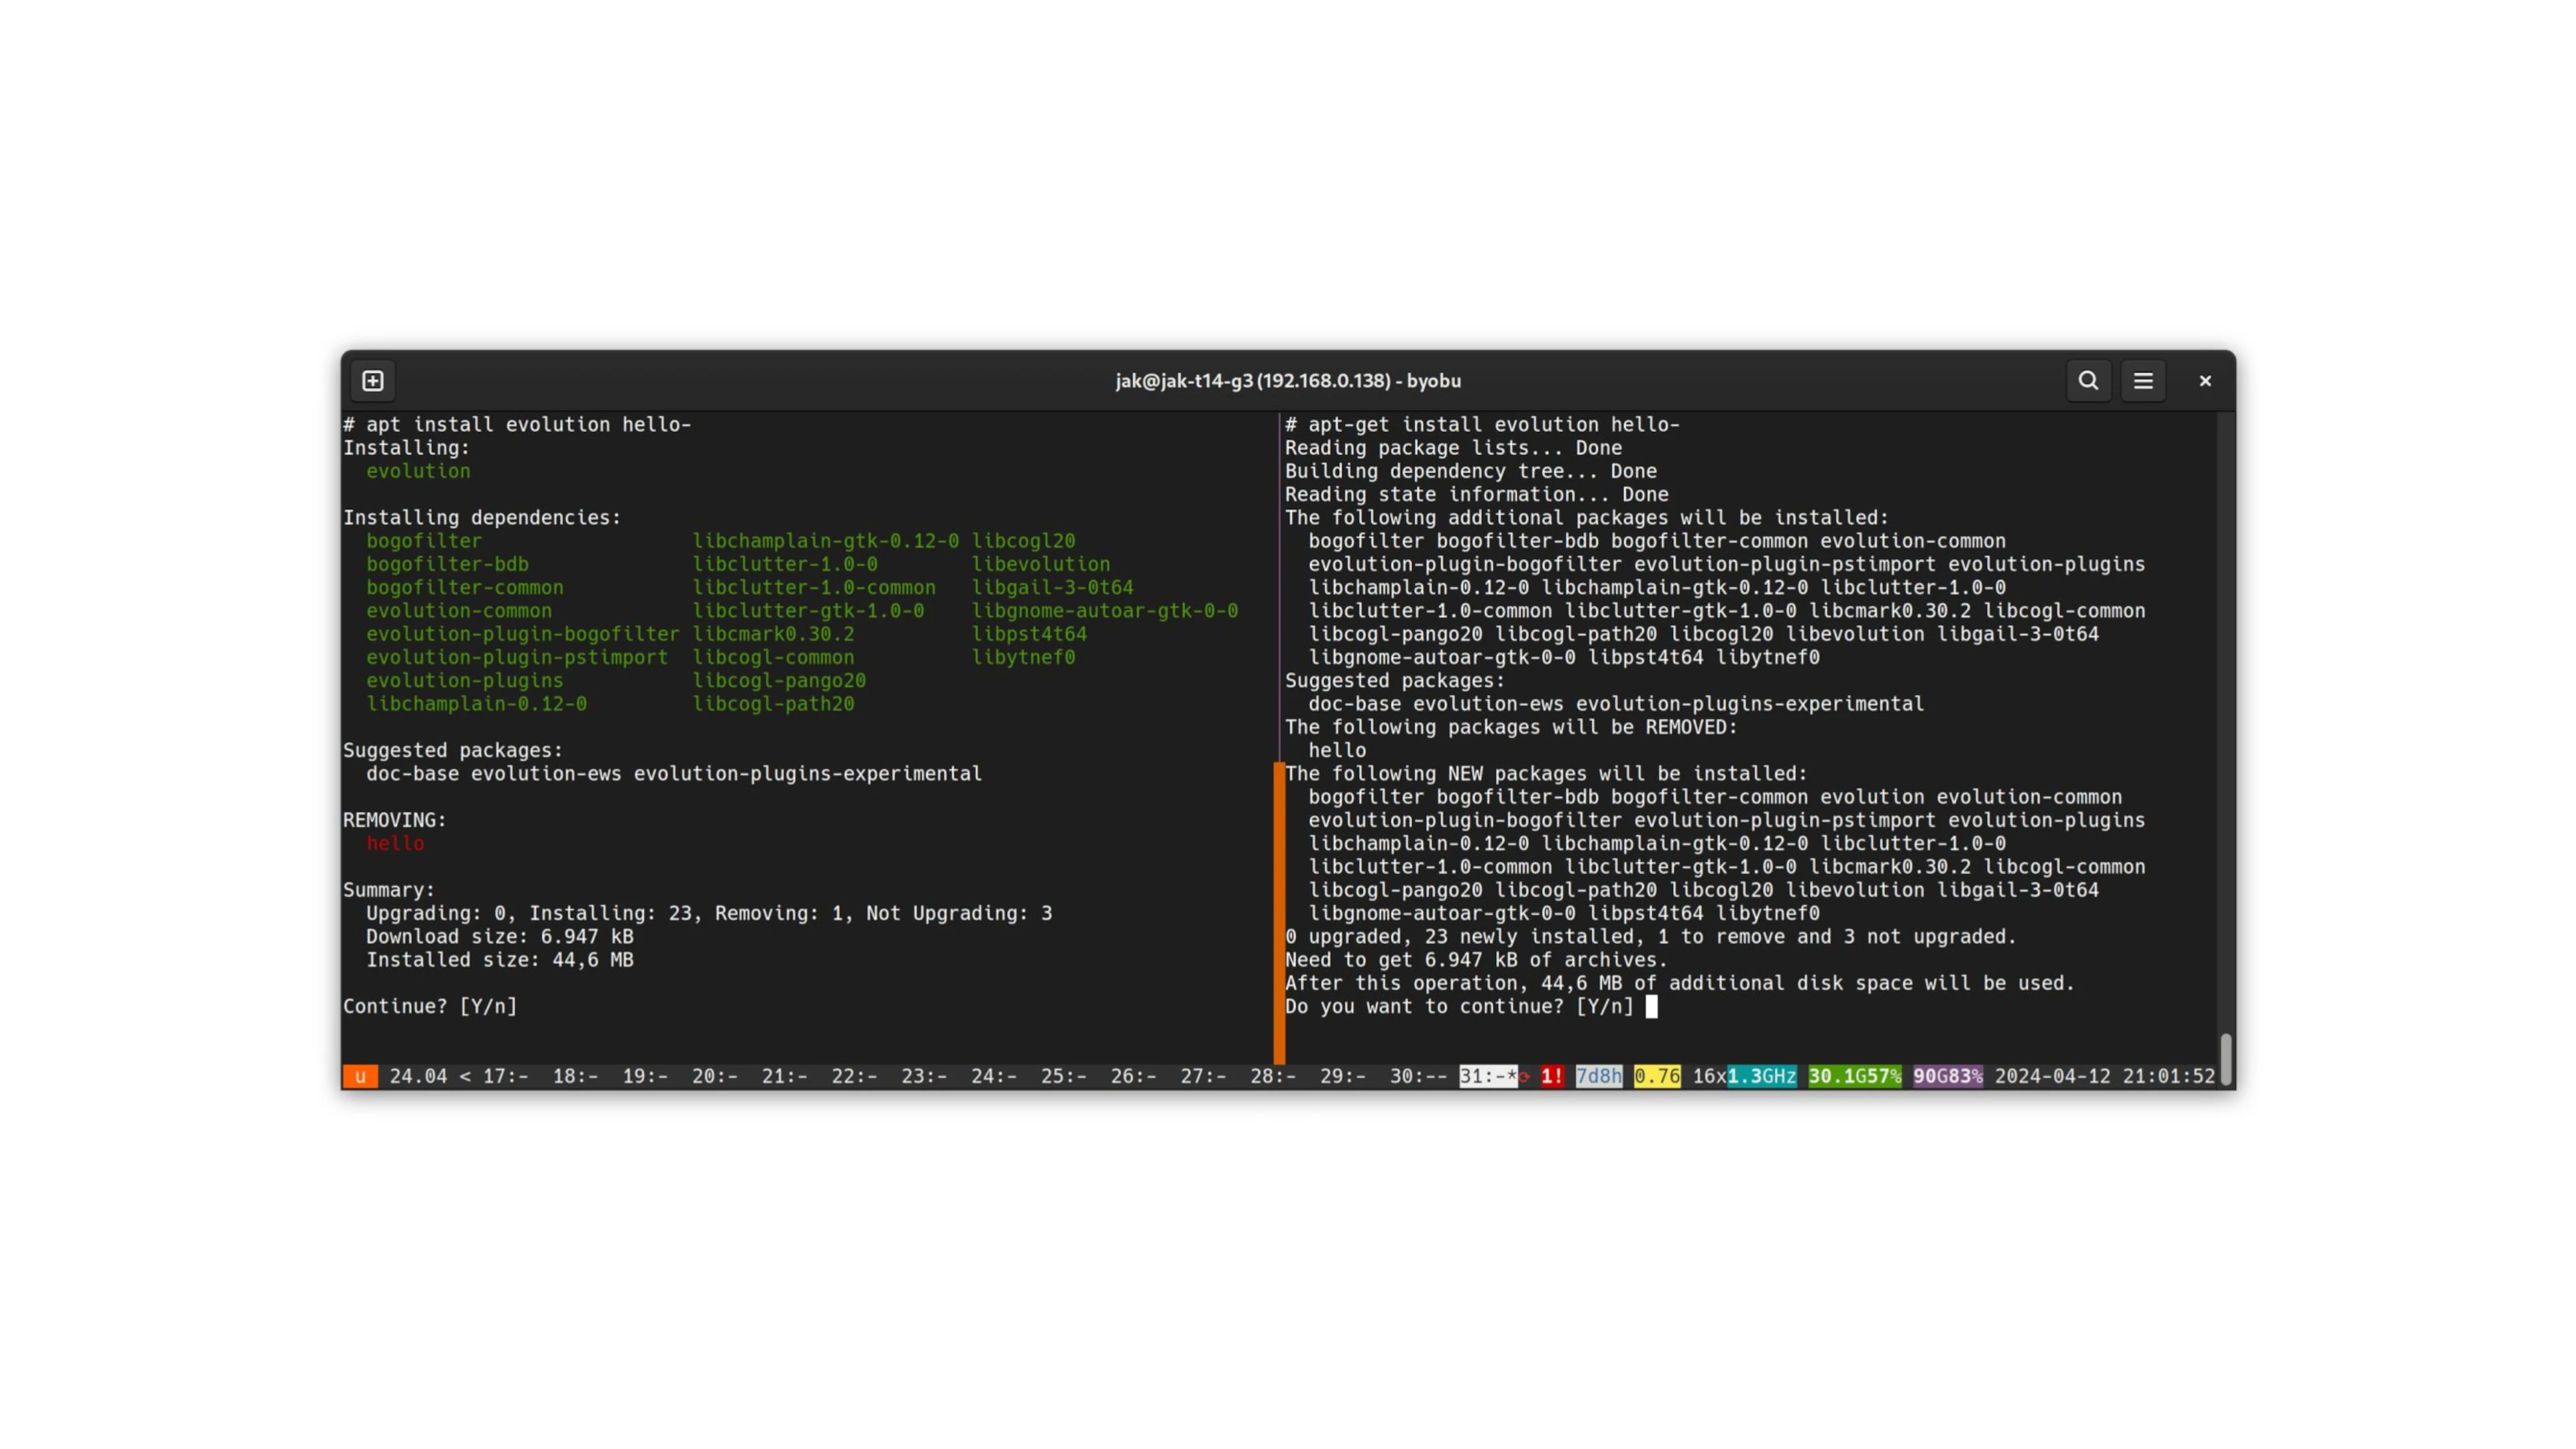
INTRODUCTION SQL(Structured Query Language) is a very crucial tool for data engineering which enables to access databases, developing data pipeline, data transformation and intergrating analytics. SQL is important for daily operations across analytics, engineering and architectural data roles. SELECT department, COUNT(*) as employee_count, AVG(salary) as avg_salary FROM employees e JOIN departments d ON e.dept_id = d.id WHERE hire_date >= '2023-01-01' GROUP BY department HAVING COUNT(*) > 5; SELECT: Specifies columns we want to choose JOIN: Connects employees and departments tables using dept_id and id WHERE: Filters only employees hired since 2023 GROUP BY: Groups results by department HAVING: Filters groups with more than 5 employees ADVANCED SQL TECHNIQUES 1. WINDOW FUNCTION These are calculations/operations that you do across a set of tables rows that are related to the current row. They return results per rows unlike aggregate functions which returns one value. SYNTAX FOR WINDOW FUNCTIONS SELECT column1, column2, function() OVER(PARTITION BY Partition_expression ORDER BY sort_expression) AS result_name form table_name SELECT employee_name, salary, department, AVG(salary) OVER (PARTITION BY department) as dept_avg, salary - AVG(salary) OVER (PARTITION BY department) as diff_from_avg FROM employees; Explanation: PARTITION BY divides data into department/categories AVG(salary) OVER calculates average within each partition Compares individual salary to department average It is useful for trend analysis and comparisons 2. CTE(COMMON TABLE EXPRESSIONS) CTE are temporary memory result set that can be referenced within a SQL statement. They last only within the execution of the query. They are used where there are many subqueries hence making the code more readable. SYNTAX OF CTEs WITH CTE_name AS(SQL query) SELECT * FROM table; WITH revenue_data AS ( SELECT product_id, SUM(amount) as total_revenue FROM sales GROUP BY product_id ), product_rankings AS ( SELECT product_id, total_revenue, RANK() OVER (ORDER BY total_revenue DESC) as revenue_rank FROM revenue_data ) SELECT * FROM product_rankings WHERE revenue_rank = '2024-01-01' AND order_date < '2025-01-01'; Replaced YEAR() function with date range (allows index usage) Specified needed columns instead of * Added proper date range conditions CREATE MATERIALIZED VIEW monthly_sales AS SELECT DATE_TRUNC('month', order_date) as month, customer_id, SUM(amount) as total_amount, COUNT(*) as order_count FROM orders GROUP BY 1, 2 WITH DATA; CREATE INDEX idx_monthly_sales_customer ON monthly_sales(customer_id); DATA MODELLING Data modelling is the creation of your data structure. This refers to how you will want your data to be organized/visual representation. Types of data modelling 1.Conceptual data modelling This represents the high level business overview of the data without going much into details. it is the simple the simplke representation of what we want from our data. 2. Lgical data modelling This describe data elements in details and helps to create a visual understanding of the data. 3. Physical data modelling This shows how data will be stored in a database for example, student_ID INT PRIMARY KEY 4. Entity-relational data model This shows the relationship that are between different database objects/entities. There are different relationships that exists between different tables in a database namely: one to many, many to many, one to one, many to many relationship. _ Data Normalization_ Normalization the process of organizing data to reduce redundancy and ensure data consistency. When you normalize a database, you break down large tables into smaller with a specific purpose. levels of normalization 1. First Normal Form (1NF) Each cell in database table must contain only a single value – no lists or multiple values are allowed. For example, instead of having multiple phone numbers in one cell, you'd create a separate phone numbers table. *2. Second Normal Form (2NF) * Ensures that all non-key attributes fully depend on the primary key. ** Third Normal Form (3NF)** Eliminates transitive dependencies, that is, data must be moved to a separate table. Denormalization This is creating a reference sheet to combine information from multiple sources into one place for easy access. It involves deliberately combining tables that were previously separated during normalization.

INTRODUCTION
SQL(Structured Query Language) is a very crucial tool for data engineering which enables to access databases, developing data pipeline, data transformation and intergrating analytics. SQL is important for daily operations across analytics, engineering and architectural data roles.
SELECT
    department,
    COUNT(*) as employee_count,
    AVG(salary) as avg_salary
FROM employees e
JOIN departments d ON e.dept_id = d.id
WHERE hire_date >= '2023-01-01'
GROUP BY department
HAVING COUNT(*) > 5;
- SELECT: Specifies columns we want to choose
- JOIN: Connects employees and departments tables using dept_id and id
- WHERE: Filters only employees hired since 2023
- GROUP BY: Groups results by department
- HAVING: Filters groups with more than 5 employees
ADVANCED SQL TECHNIQUES
1. WINDOW FUNCTION
These are calculations/operations that you do across a set of tables rows that are related to the current row. They return results per rows unlike aggregate functions which returns one value.
SYNTAX FOR WINDOW FUNCTIONS
SELECT column1, column2, function() OVER(PARTITION BY Partition_expression ORDER BY sort_expression) AS result_name form table_name
SELECT
    employee_name,
    salary,
    department,
    AVG(salary) OVER (PARTITION BY department) as dept_avg,
    salary - AVG(salary) OVER (PARTITION BY department) as diff_from_avg
FROM employees;
Explanation:
- PARTITION BY divides data into department/categories
- AVG(salary) OVER calculates average within each partition
- Compares individual salary to department average
- It is useful for trend analysis and comparisons
2. CTE(COMMON TABLE EXPRESSIONS)
CTE are temporary memory result set that can be referenced within a SQL statement. They last only within the execution of the query. They are used where there are many subqueries hence making the code more readable.
SYNTAX OF CTEs
WITH CTE_name AS(SQL query)

SELECT * FROM table;
WITH revenue_data AS (
    SELECT product_id,
           SUM(amount) as total_revenue
    FROM sales
    GROUP BY product_id
),
product_rankings AS (
    SELECT product_id,
           total_revenue,
           RANK() OVER (ORDER BY total_revenue DESC) as revenue_rank
    FROM revenue_data
)
SELECT * FROM product_rankings WHERE revenue_rank <= 10;
- First CTE revenue_data is created with keyword WITH to calculate total revenue per product
- Second CTE product_rankingsis created to rank products by revenue
- We selects top 10 products
3. STORED PROCEDURE
Stored procedure is a SQL statement/ block of queries that you can save and use in the future. They help to save time, make our complex queries more simplified during execution and enhance the database security.
SYNTAX OF STORED PROCEDURE
CREATE PROCEDURE procedure_name

AS

BEGIN

SQL STATEMENT

END;

EXEC procedure_name;
QUERY OPTIMIZATION AND PERFORMANCE TUNING
SQL performance tuning refers to the process of optimizing database queries and operations to ensure faster and more efficient data retrieval.It enhances query execution by addressing problems in storing, indexing, and accessing data. Implementing indexing, eliminating unneccesary operations, use of appropriate data types and reducing subqueries can help achieve faster query execution and better resource utilization.
Before optimization:
SELECT *
FROM orders
WHERE YEAR(order_date) = 2024;
After optimization:
SELECT order_id, customer_id, amount
FROM orders
WHERE order_date >= '2024-01-01'
AND order_date < '2025-01-01';
- Replaced YEAR() function with date range (allows index usage)
- Specified needed columns instead of *
- Added proper date range conditions
CREATE MATERIALIZED VIEW monthly_sales AS
SELECT
    DATE_TRUNC('month', order_date) as month,
    customer_id,
    SUM(amount) as total_amount,
    COUNT(*) as order_count
FROM orders
GROUP BY 1, 2
WITH DATA;

CREATE INDEX idx_monthly_sales_customer
ON monthly_sales(customer_id);
DATA MODELLING
Data modelling is the creation of your data structure. This refers to how you will want your data to be organized/visual representation.
Types of data modelling
1.Conceptual data modelling
This represents the high level business overview of the data without going much into details. it is the simple the simplke representation of what we want from our data.
2. Lgical data modelling
This describe data elements in details and helps to create a visual understanding of the data.
3. Physical data modelling
This shows how data will be stored in a database for example, student_ID INT PRIMARY KEY
4. Entity-relational data model
This shows the relationship that are between different database objects/entities. There are different relationships that exists between different tables in a database namely: one to many, many to many, one to one, many to many relationship.
_
Data Normalization_
Normalization the process of organizing data to reduce redundancy and ensure data consistency. When you normalize a database, you break down large tables into smaller with a specific purpose.
levels of normalization
1. First Normal Form (1NF)
Each cell in database table must contain only a single value – no lists or multiple values are allowed. For example, instead of having multiple phone numbers in one cell, you'd create a separate phone numbers table.
*2. Second Normal Form (2NF) *
Ensures that all non-key attributes fully depend on the primary key.
**
- Third Normal Form (3NF)**
Eliminates transitive dependencies, that is, data must be moved to a separate table.
Denormalization
This is creating a reference sheet to combine information from multiple sources into one place for easy access. It involves deliberately combining tables that were previously separated during normalization.