


![[The AI Show Episode 142]: ChatGPT’s New Image Generator, Studio Ghibli Craze and Backlash, Gemini 2.5, OpenAI Academy, 4o Updates, Vibe Marketing & xAI Acquires X](https://www.marketingaiinstitute.com/hubfs/ep%20142%20cover.png)


![From drop-out to software architect with Jason Lengstorf [Podcast #167]](https://cdn.hashnode.com/res/hashnode/image/upload/v1743796461357/f3d19cd7-e6f5-4d7c-8bfc-eb974bc8da68.png?#)


.png?#)


_Christophe_Coat_Alamy.jpg?#)
 (1).webp?#)


![Apple Considers Delaying Smart Home Hub Until 2026 [Gurman]](https://www.iclarified.com/images/news/96946/96946/96946-640.jpg)
![iPhone 17 Pro Won't Feature Two-Toned Back [Gurman]](https://www.iclarified.com/images/news/96944/96944/96944-640.jpg)
![Tariffs Threaten Apple's $999 iPhone Price Point in the U.S. [Gurman]](https://www.iclarified.com/images/news/96943/96943/96943-640.jpg)


Enable Aurora logs for security audits
AWS Aurora provides serverless database capability with enhanced features that you can find here. By default, AWS Aurora enables error logs but audit logs are disabled. When running a database in production, one can collect logs from application and other aws services. For Aurora monitoring, we can check metrics from CloudWatch and more granular metrics by enabling performance insight. However, under certain requirements, we may need to analyze database transactions for which we want to enable audit logs. As an SRE/DevOps or DB admin, one use case I came across is when the analytics team wants to analyze those audit logs. In another situation, in order to follow PCI, PII, SOC2 and more security compliance we need to enable audit logs. I am also adding steps of creating a cluster, assuming you want to test this in a lab or test account. Step1: Creating the Aurora cluster Search for Aurora service from the search bar. Note: As shared in the above screenshot, I am using the postgreSQL engine from available options. Here, I have selected dev/test in the template option. For Master username, you can change it, I am using default. After creating the cluster, automatically credentials will be saved in the secret manager service. You can use it to get the password to connect with the database. Before selecting create cluster at the bottom, you may see Log exports with options Instance log and PostgreSQL logs. In case you are thinking, if any of these options will enable audit logs, the answer is No. Let’s know about these two options first. Note: To send PostgresSQL logs to CloudWatch, you must enable PostgreSQL log option otherwise you won't even see CloudWatch log group. By default, Aurora enables error logs. Error store these logs to log/postgresql.log file. This will capture all errors like query failures, server errors, login failures. If you select the PostgreSQL log option, the cluster will keep error logs but in addition enable PostgreSQL general logs like log_statement, log_duration etc and export to CloudWatch. If you enable the instance log option, there will be a separate file created for it with name instance.log. You will it in logs and events tab. Now, we understand the basics on log options available when creating the Aurora cluster. Now, click on the Create Cluster from the bottom right button. We will see cluster creation in progress and the state will be changed to available in a short time. Step2: Enable access logs As we have a cluster running, we need to open the cluster page. Click on the parameter groups as highlighted in the screenshot on left sidebar. When you click on the parameter groups link, you will see options custom and Default. Default option will show groups that were created by default during cluster creation. We don't have permission to edit parameters in Default parameter groups. So, we will switch back to the custom option and click on the Create Parameter group button on the right. Now, we open our custom parameter and Click Edit on the right. In my case, I only had to enable log_connections and log_disconnections. So, I can updated them with available binary value 1 to enable them. This means to log all connection and disconnection to track record of users login and logout. This is useful for security audits. LOG: connection authorized: user=app_user database=mydb application=psql host=10.0.1.5 and LOG: disconnection: session time: 0:00:05.233 user=app_user database=mydb host=10.0.1.5 To improve the log_line structure and add log_line_prefix and change default value from %t:%r:%u@%d:[%p]: to %t [%p]: [%l-1] user=%u,db=%d,app=%a,client=%h This will improve log_line output structure and provide logs 2025-04-02 15:35:12 [19456]: [3-1] user=app_user,db=finance_db,app=psql,client=10.1.2.3 AUDIT: SESSION,1,1,READ,SELECT,,,SELECT * FROM accounts; Now, we save these changes and switch back to our cluster page. Click on the Modify option. Click the instance and go to the configuration tab. Search for the parameter option and update it with our custom parameter from default parameter. It will take sometime for the cluster changes to take effect. Now, check in the cloudwatch, you will find log-group for Aurora postgres. That concludes our article. We will take it further in next blog. For more granular logging, you can use pg_audit extension for which there is a detailed guide available in aws documentation.
AWS Aurora provides serverless database capability with enhanced features that you can find here. By default, AWS Aurora enables error logs but audit logs are disabled. When running a database in production, one can collect logs from application and other aws services. For Aurora monitoring, we can check metrics from CloudWatch and more granular metrics by enabling performance insight. However, under certain requirements, we may need to analyze database transactions for which we want to enable audit logs. As an SRE/DevOps or DB admin, one use case I came across is when the analytics team wants to analyze those audit logs. In another situation, in order to follow PCI, PII, SOC2 and more security compliance we need to enable audit logs.
I am also adding steps of creating a cluster, assuming you want to test this in a lab or test account.
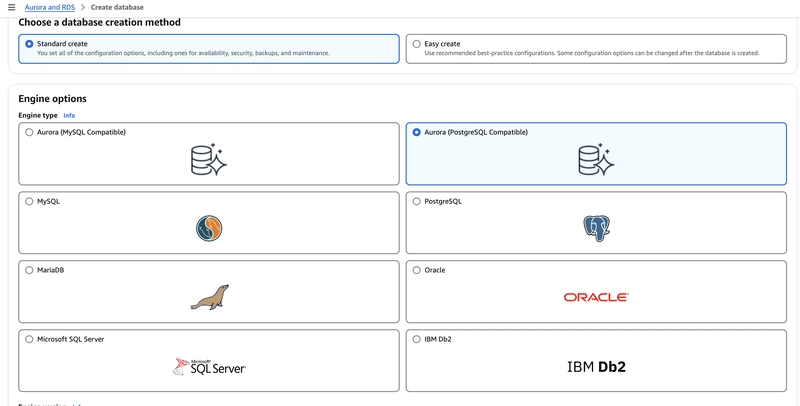
Step1: Creating the Aurora cluster
Search for Aurora service from the search bar.
Note: As shared in the above screenshot, I am using the postgreSQL engine from available options.
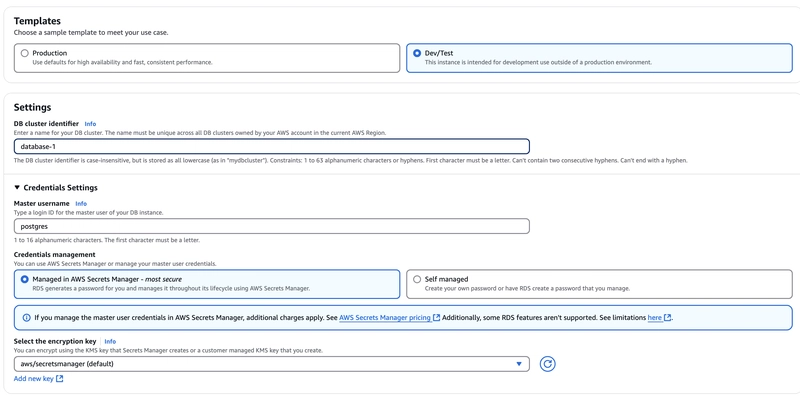
Here, I have selected dev/test in the template option. For Master username, you can change it, I am using default. After creating the cluster, automatically credentials will be saved in the secret manager service. You can use it to get the password to connect with the database.
Before selecting create cluster at the bottom, you may see Log exports with options
Instance log and PostgreSQL logs. In case you are thinking, if any of these options will enable audit logs, the answer is No. Let’s know about these two options first.
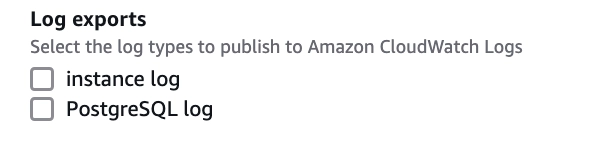
Note: To send PostgresSQL logs to CloudWatch, you must enable PostgreSQL log option otherwise you won't even see CloudWatch log group.
By default, Aurora enables error logs. Error store these logs to log/postgresql.log file. This will capture all errors like query failures, server errors, login failures.
If you select the PostgreSQL log option, the cluster will keep error logs but in addition enable PostgreSQL general logs like log_statement, log_duration etc and export to CloudWatch.
If you enable the instance log option, there will be a separate file created for it with name instance.log. You will it in logs and events tab.
Now, we understand the basics on log options available when creating the Aurora cluster.
Now, click on the Create Cluster from the bottom right button.
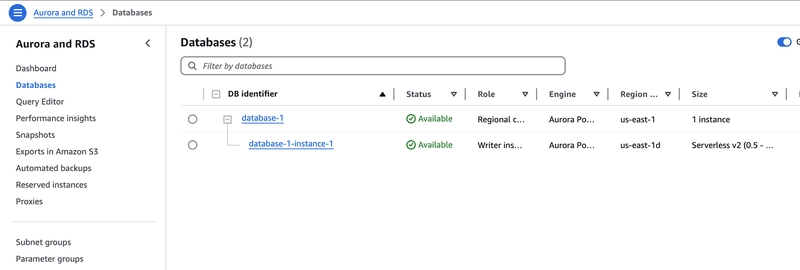
We will see cluster creation in progress and the state will be changed to available in a short time.
Step2: Enable access logs
As we have a cluster running, we need to open the cluster page.
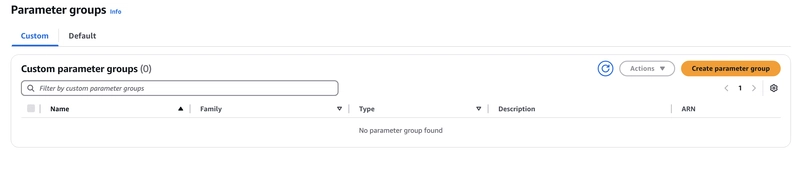
Click on the parameter groups as highlighted in the screenshot on left sidebar.
When you click on the parameter groups link, you will see options custom and Default.
Default option will show groups that were created by default during cluster creation. We don't have permission to edit parameters in Default parameter groups.
So, we will switch back to the custom option and click on the Create Parameter group button on the right.
Now, we open our custom parameter and Click Edit on the right.
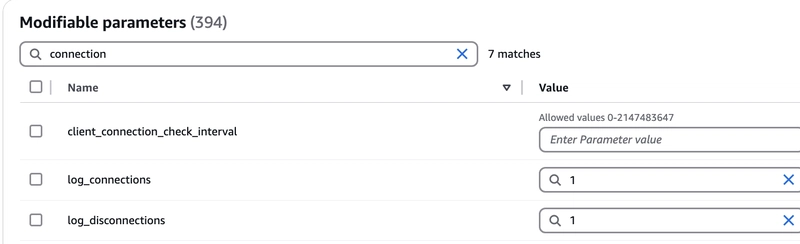
In my case, I only had to enable log_connections and log_disconnections. So, I can updated them with available binary value 1 to enable them. This means to log all connection and disconnection to track record of users login and logout. This is useful for security audits.
LOG: connection authorized: user=app_user database=mydb application=psql host=10.0.1.5
and
LOG: disconnection: session time: 0:00:05.233 user=app_user database=mydb host=10.0.1.5
To improve the log_line structure and add log_line_prefix and change default value from
%t:%r:%u@%d:[%p]:
to
%t [%p]: [%l-1] user=%u,db=%d,app=%a,client=%h
This will improve log_line output structure and provide logs
2025-04-02 15:35:12 [19456]: [3-1] user=app_user,db=finance_db,app=psql,client=10.1.2.3 AUDIT: SESSION,1,1,READ,SELECT,,,SELECT * FROM accounts;
Now, we save these changes and switch back to our cluster page.
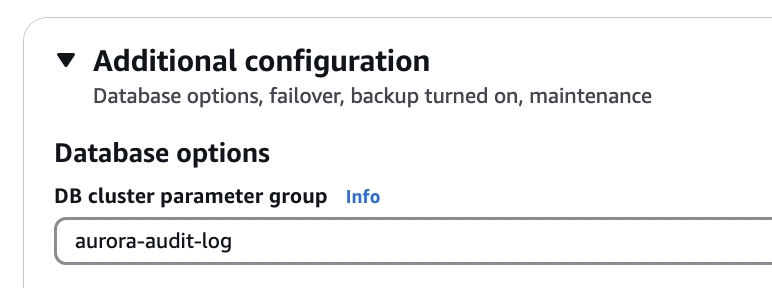
Click on the Modify option.
Click the instance and go to the configuration tab.
Search for the parameter option and update it with our custom parameter from default parameter.
It will take sometime for the cluster changes to take effect.
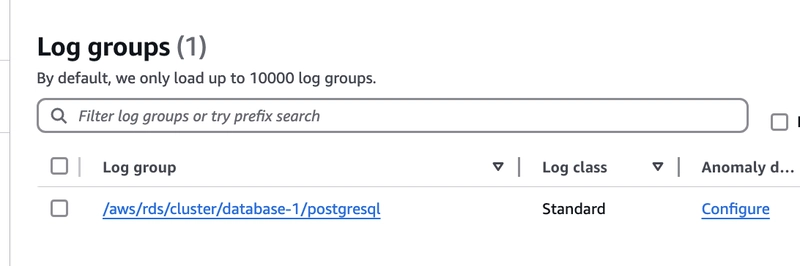
Now, check in the cloudwatch, you will find log-group for Aurora postgres.
That concludes our article. We will take it further in next blog.
For more granular logging, you can use pg_audit extension for which there is a detailed guide available in aws documentation.