


![[The AI Show Episode 144]: ChatGPT’s New Memory, Shopify CEO’s Leaked “AI First” Memo, Google Cloud Next Releases, o3 and o4-mini Coming Soon & Llama 4’s Rocky Launch](https://www.marketingaiinstitute.com/hubfs/ep%20144%20cover.png)


_Andreas_Prott_Alamy.jpg?width=1280&auto=webp&quality=80&disable=upscale#)


![What features do you get with Gemini Advanced? [April 2025]](https://i0.wp.com/9to5google.com/wp-content/uploads/sites/4/2024/02/gemini-advanced-cover.jpg?resize=1200%2C628&quality=82&strip=all&ssl=1)


![Apple Shares Official Trailer for 'Long Way Home' Starring Ewan McGregor and Charley Boorman [Video]](https://www.iclarified.com/images/news/97069/97069/97069-640.jpg)
![Apple Watch Series 10 Back On Sale for $299! [Lowest Price Ever]](https://www.iclarified.com/images/news/96657/96657/96657-640.jpg)
![EU Postpones Apple App Store Fines Amid Tariff Negotiations [Report]](https://www.iclarified.com/images/news/97068/97068/97068-640.jpg)


![Mobile Legends: Bang Bang [MLBB] Free Redeem Codes April 2025](https://www.talkandroid.com/wp-content/uploads/2024/07/Screenshot_20240704-093036_Mobile-Legends-Bang-Bang.jpg)


Implementing the Program Evaluation and Review Technique (PERT) in Software Projects
Introduction Software development projects are notoriously difficult to estimate. We've all been there – confidently promising a delivery date only to watch it slip away as unexpected challenges emerge. Whether you're building a new feature, refactoring legacy code, or launching a complete application, accurate timeline estimation remains one of the most challenging aspects of software project management. This is where the Program Evaluation and Review Technique (PERT) comes in – a powerful statistical tool that can transform how you approach project planning and execution. Let's dive into how PERT can help your development team create more realistic timelines and deliver projects with greater confidence. What is PERT and Why Should Developers Care? The Program Evaluation and Review Technique (PERT) is a statistical tool that maps and coordinates tasks within complex projects. It breaks down projects into smaller, manageable components while calculating realistic timelines for completion. Originally developed by the U.S. Navy in 1958 for the Polaris nuclear submarine project, PERT proved crucial in managing thousands of contractors and tracking numerous parallel activities. Its success led to widespread adoption across industries, including software development. For developers, PERT offers a systematic approach to project planning that accounts for the inherent uncertainties in software development. Unlike traditional single-point estimates that often lead to missed deadlines, PERT uses a three-point estimation system that provides more reliable project timelines. The beauty of PERT for software teams lies in its ability to handle uncertainty. Software development is inherently unpredictable – new bugs emerge, technical debt causes unexpected delays, and requirements evolve. PERT embraces this uncertainty rather than ignoring it, making it particularly valuable for development teams working in complex environments. Core Components of PERT PERT networks consist of two main elements: Events: Specific milestones or completion points Activities: The actual work needed to progress between events The network uses nodes (typically circles or rectangles) connected by arrows to show task dependencies and workflow direction. In software development, events might include "database schema finalized," "API documentation complete," or "user authentication module tested." Activities would be the actual development work, like "design database schema," "document API endpoints," or "implement user authentication." The visual nature of PERT networks makes them excellent communication tools. They provide a clear picture of project structure that both technical and non-technical stakeholders can understand, bridging the gap between development teams and business leaders. The PERT Formula: How It Works What makes PERT particularly valuable for software projects is its approach to time estimation. Instead of relying on a single time estimate (which is often optimistic), PERT uses three time estimates for each activity: Optimistic Time (O): The shortest possible completion time if everything goes perfectly Most Likely Time (M): The realistic completion time under normal circumstances Pessimistic Time (P): The maximum expected duration if significant problems occur These estimates are combined into a weighted average using the PERT formula: Expected Time = (O + 4M + P) ÷ 6 This formula gives extra weight to the Most Likely Time estimate, reflecting its greater probability of occurrence while still accounting for best and worst-case scenarios. The formula also allows for calculating the standard deviation for each activity: Standard Deviation = (P - O) ÷ 6 This provides a measure of uncertainty for each task. Higher standard deviations indicate greater uncertainty, helping project managers identify high-risk activities that may require additional attention or resources. Benefits of PERT for Software Development Teams 1. More Accurate Timeline Projections Software development projects often involve intricate and multifaceted deliverables. By leveraging PERT, development teams can refine time estimation methodologies, accurately predict project timelines, and proactively manage client expectations. Traditional estimation methods often fail because they rely on best-case scenarios. PERT's three-point estimation acknowledges that things rarely go perfectly in software development. This realistic approach leads to more accurate delivery dates and fewer uncomfortable conversations with stakeholders about missed deadlines. 2. Better Resource Allocation Software projects require diverse resources, including developers, designers, QA specialists, and infrastructure. PERT provides valuable insights into resource requirements for each project phase, ensuring optimal utilization and allocation. By identifying the critical pat
Introduction
Software development projects are notoriously difficult to estimate. We've all been there – confidently promising a delivery date only to watch it slip away as unexpected challenges emerge.
Whether you're building a new feature, refactoring legacy code, or launching a complete application, accurate timeline estimation remains one of the most challenging aspects of software project management.
This is where the Program Evaluation and Review Technique (PERT) comes in – a powerful statistical tool that can transform how you approach project planning and execution.
Let's dive into how PERT can help your development team create more realistic timelines and deliver projects with greater confidence.
What is PERT and Why Should Developers Care?
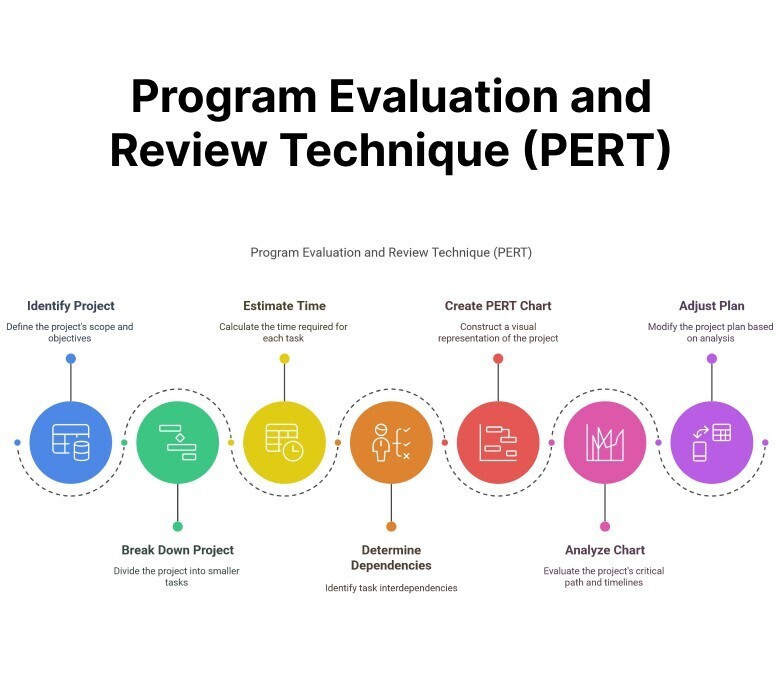
The Program Evaluation and Review Technique (PERT) is a statistical tool that maps and coordinates tasks within complex projects. It breaks down projects into smaller, manageable components while calculating realistic timelines for completion.
Originally developed by the U.S. Navy in 1958 for the Polaris nuclear submarine project, PERT proved crucial in managing thousands of contractors and tracking numerous parallel activities. Its success led to widespread adoption across industries, including software development.
For developers, PERT offers a systematic approach to project planning that accounts for the inherent uncertainties in software development.
Unlike traditional single-point estimates that often lead to missed deadlines, PERT uses a three-point estimation system that provides more reliable project timelines.
The beauty of PERT for software teams lies in its ability to handle uncertainty. Software development is inherently unpredictable – new bugs emerge, technical debt causes unexpected delays, and requirements evolve.
PERT embraces this uncertainty rather than ignoring it, making it particularly valuable for development teams working in complex environments.
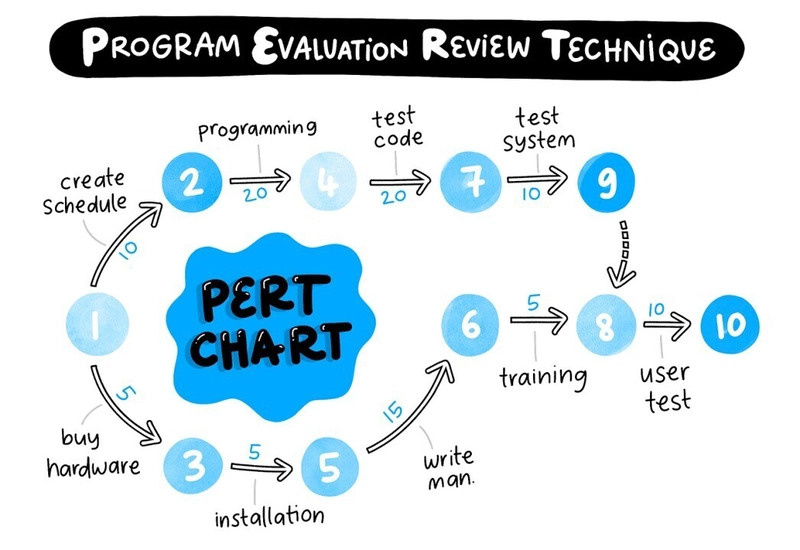
Core Components of PERT
PERT networks consist of two main elements:
- Events: Specific milestones or completion points
- Activities: The actual work needed to progress between events
The network uses nodes (typically circles or rectangles) connected by arrows to show task dependencies and workflow direction.
In software development, events might include "database schema finalized," "API documentation complete," or "user authentication module tested."
Activities would be the actual development work, like "design database schema," "document API endpoints," or "implement user authentication."
The visual nature of PERT networks makes them excellent communication tools. They provide a clear picture of project structure that both technical and non-technical stakeholders can understand, bridging the gap between development teams and business leaders.
The PERT Formula: How It Works
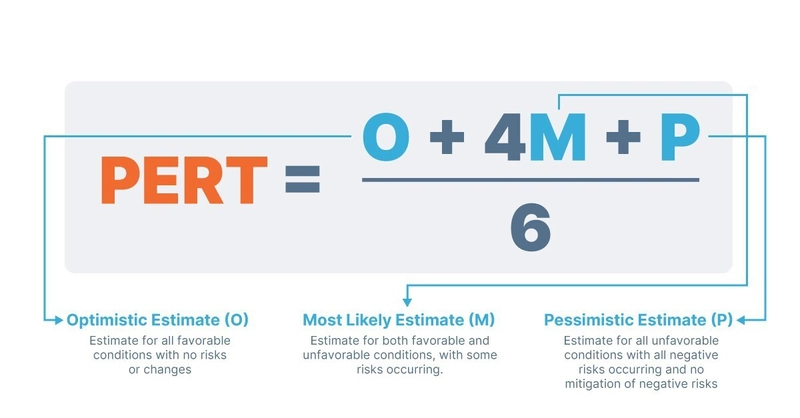
What makes PERT particularly valuable for software projects is its approach to time estimation. Instead of relying on a single time estimate (which is often optimistic), PERT uses three time estimates for each activity:
- Optimistic Time (O): The shortest possible completion time if everything goes perfectly
- Most Likely Time (M): The realistic completion time under normal circumstances
- Pessimistic Time (P): The maximum expected duration if significant problems occur
These estimates are combined into a weighted average using the PERT formula:
Expected Time = (O + 4M + P) ÷ 6
This formula gives extra weight to the Most Likely Time estimate, reflecting its greater probability of occurrence while still accounting for best and worst-case scenarios.
The formula also allows for calculating the standard deviation for each activity:
Standard Deviation = (P - O) ÷ 6
This provides a measure of uncertainty for each task. Higher standard deviations indicate greater uncertainty, helping project managers identify high-risk activities that may require additional attention or resources.
Benefits of PERT for Software Development Teams
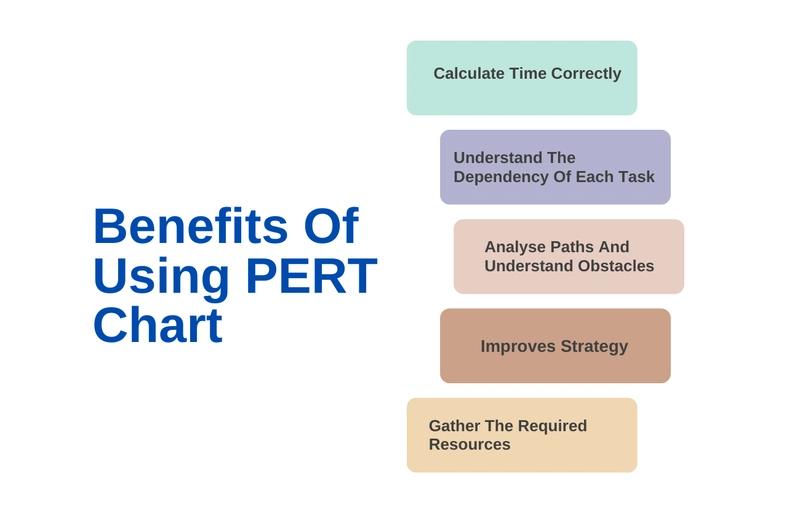
1. More Accurate Timeline Projections
Software development projects often involve intricate and multifaceted deliverables. By leveraging PERT, development teams can refine time estimation methodologies, accurately predict project timelines, and proactively manage client expectations.
Traditional estimation methods often fail because they rely on best-case scenarios. PERT's three-point estimation acknowledges that things rarely go perfectly in software development. This realistic approach leads to more accurate delivery dates and fewer uncomfortable conversations with stakeholders about missed deadlines.
2. Better Resource Allocation
Software projects require diverse resources, including developers, designers, QA specialists, and infrastructure. PERT provides valuable insights into resource requirements for each project phase, ensuring optimal utilization and allocation.
By identifying the critical path, teams can focus their most skilled resources on the tasks that directly impact project timelines. This prevents the common scenario where key developers are assigned to non-critical tasks while bottlenecks form elsewhere.
3. Enhanced Risk Management
Uncertainty is inherent in software development. PERT helps identify potential risks and their impact on project timelines. By integrating risk assessment into the evaluation process, teams can proactively mitigate risks and navigate unforeseen challenges with agility.
The standard deviation calculations in PERT highlight activities with high uncertainty, allowing teams to implement risk mitigation strategies like adding buffer time, assigning additional resources, or creating contingency plans for high-risk tasks.
4. Improved Team Communication
PERT provides a visual representation of the project's activities, fostering transparency and shared understanding among team members. This clear visualization enables enhanced collaboration, aligning the efforts of development teams toward achieving project goals.
The network diagram serves as a common reference point during stand-ups, sprint planning, and stakeholder meetings. It helps everyone understand not just their own tasks, but how their work fits into the larger project context and affects other team members.
5. Critical Path Identification
PERT helps identify the critical path – the longest sequence of tasks that must be completed to successfully finish the project. This allows teams to focus resources on these critical activities to ensure timely project completion.
In software development, the critical path often includes complex technical challenges, integration points between systems, or tasks requiring specialized knowledge. Identifying these bottlenecks early allows teams to address them proactively rather than scrambling when they become urgent.
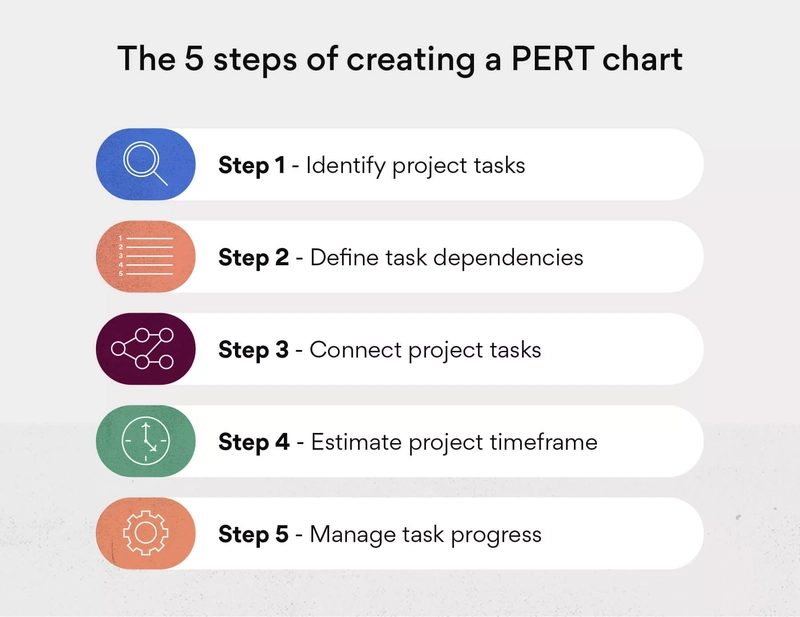
Implementing PERT in Your Software Development Projects
Now that we understand the benefits, let's look at how to implement PERT in your software development workflow:
Step 1: Identify All Project Activities and Milestones
Start by breaking down your software project into specific activities and milestones. For a typical software development project, this might include:
- Requirements gathering and analysis
- System architecture design
- Database schema design
- API endpoint definition
- UI/UX wireframing and design
- Front-end component development
- Back-end service implementation
- Integration between front-end and back-end
- Unit testing
- Integration testing
- Performance testing
- Security testing
- Bug fixing and refinement
- Documentation
- Deployment preparation
- Production deployment
Be thorough in this step – missing key activities can undermine the entire PERT analysis. Involve team members from different disciplines to ensure all necessary tasks are captured.
Step 2: Determine Task Dependencies
Identify which tasks depend on others. For example, back-end development might depend on database design, while integration testing depends on both front-end and back-end development being completed.
For a software project, your dependencies might look like this:
- Requirements gathering (no dependencies)
- System architecture design (depends on requirements gathering)
- Database schema design (depends on system architecture design)
- API endpoint definition (depends on system architecture design)
- UI/UX wireframing (depends on requirements gathering)
- UI/UX final design (depends on UI/UX wireframing)
- Front-end component development (depends on UI/UX final design and API endpoint definition)
- Back-end service implementation (depends on database schema design and API endpoint definition)
- Integration between front-end and back-end (depends on front-end component development and back-end service implementation)
- Unit testing (can run in parallel with development)
- Integration testing (depends on integration between front-end and back-end)
- Performance testing (depends on integration testing)
- Security testing (depends on integration testing)
- Bug fixing and refinement (depends on all testing phases)
- Documentation (can run in parallel with development)
- Deployment preparation (depends on bug fixing and refinement)
- Production deployment (depends on deployment preparation)
Dependencies are crucial for creating an accurate network diagram and identifying the critical path. Take time to think through logical relationships between tasks, considering both technical requirements and team workflows.
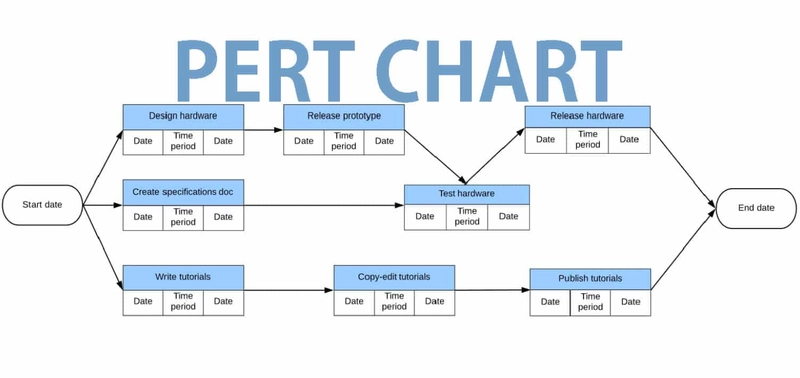
Step 3: Create a Network Diagram
Using the activity sequence information, create a network diagram showing the sequence of serial and parallel activities. Each activity represents a node in the network, and the arrows represent the relationship between activities.
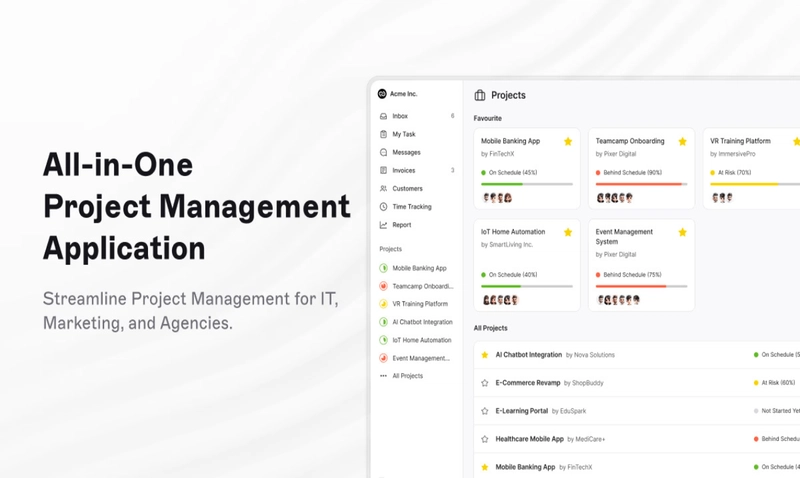
Modern project management tools like Teamcamp can help you visualize these relationships with intuitive interfaces. Teamcamp's unified project dashboard gives you complete control with a centralized view of all your projects, tasks, and resources, making it easier to create and maintain your PERT diagram.
When creating your network diagram, look for opportunities to run tasks in parallel. For example, while back-end development is underway, the UI/UX team can work on front-end designs. Identifying these parallel paths can significantly reduce overall project duration.
Step 4: Estimate Activity Durations
For each activity, gather three time estimates:
- Optimistic: Best-case scenario (everything goes perfectly)
- Most likely: Normal conditions (typical challenges encountered and resolved)
- Pessimistic: Worst-case scenario (significant problems occur)
Calculate the expected duration using the PERT formula: (Optimistic + 4 × Most likely + Pessimistic) ÷ 6.
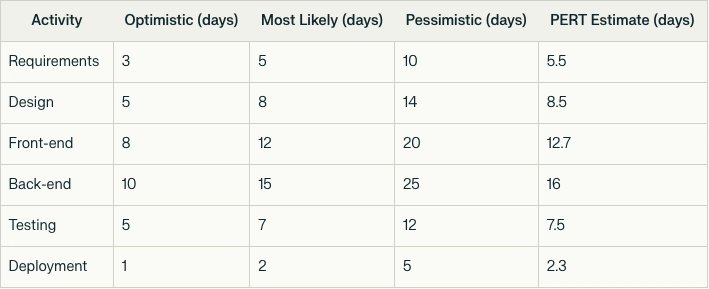
For example, if front-end development has an optimistic estimate of 5 days, a most likely estimate of 8 days, and a pessimistic estimate of 15 days, the PERT estimate would be:
**(5 + 4×8 + 15) ÷ 6 = (5 + 32 + 15) ÷ 6 = 52 ÷ 6 = 8.67 days**
When gathering these estimates, involve the team members who will actually perform the work. Developers, designers, and testers typically have the best understanding of how long their tasks will take. Consider historical data from similar past projects to inform your estimates.
Step 5: Calculate the Critical Path
Add the expected durations along each possible path through your network diagram. The path with the longest total duration is your critical path. These are the activities that cannot be delayed without delaying the entire project.
For example, if your network has these paths:
- Path 1: Requirements → Architecture → Database → Back-end → Integration → Testing → Deployment (42 days)
- Path 2: Requirements → Architecture → API → Front-end → Integration → Testing → Deployment (38 days)
- Path 3: Requirements → UI/UX → Front-end → Integration → Testing → Deployment (35 days)
Path 1 would be your critical path at 42 days. Any delay in these activities will delay your entire project.
You can also calculate float (or slack) for non-critical activities. Float represents how long an activity can be delayed without affecting the project timeline. Activities on the critical path have zero float.
Step 6: Monitor and Update
As your project progresses, track actual performance against your PERT estimates. Update your network diagram and recalculate the critical path as needed to reflect changes in scope or timeline.
Teamcamp's real-time tracking features make this ongoing monitoring process seamless. The platform allows you to update task statuses, track time spent, and visualize progress against your original PERT estimates.
Regular reviews of your PERT analysis (perhaps during sprint retrospectives) help teams learn from estimation errors and continuously improve their planning process.
Real-World Example: Implementing PERT in a Web Application Development Project
Let's look at how PERT might be applied to a typical web application development project:
Project Breakdown: The team identifies key activities including requirements gathering, design, front-end development, back-end development, testing, and deployment.
Time Estimation: For each activity, the team provides three time estimates:
-
Network Diagram: The team creates a network diagram showing dependencies between activities. They identify several potential paths through the project:
- Path A: Requirements → System Design → Database Design → Back-end → Integration → Testing → Bug Fixing → Deployment
- Path B: Requirements → System Design → API Design → Front-end → Integration → Testing → Bug Fixing → Deployment
- Path C: Requirements → UI/UX Design → Front-end → Integration → Testing → Bug Fixing → Deployment
Critical Path Analysis: After calculating the duration of each path, the team identifies Path A as the critical path, with a total duration of approximately 49.5 days. This path includes Requirements → System Design → Database Design → Back-end → Integration → Testing → Bug Fixing → Deployment.
Resource Allocation: With the critical path identified, the team allocates their most experienced developers to back-end development and database design to minimize the risk of delays. They also identify that front-end development has 3.8 days of float, allowing some flexibility in scheduling the front-end team.
Progress Tracking: Using Teamcamp's project tracking features, the team monitors progress against the PERT estimates. During week three, they discover that database design is taking longer than expected. They immediately update their PERT diagram, which shows that the delay will impact the critical path. The project manager reallocates resources to get database design back on track.
Risk Management: The team notices that back-end development has the highest standard deviation (2.5 days), indicating significant uncertainty. They mitigate this risk by implementing a modular approach, allowing parallel work on different back-end components and reducing the impact of any single delay.
Integrating PERT with Modern Project Management Tools
While PERT is a powerful technique on its own, its effectiveness can be enhanced when integrated with modern project management tools. Teamcamp, for example, offers features that complement PERT implementation:
Build Sustainably with Teamcamp
Unified Project Dashboard: Experience complete control with a centralized view of all your projects, tasks, and resources. The dashboard aggregates real-time updates and key metrics in one intuitive interface, empowering you to make informed decisions quickly and efficiently.
Milestone & Deadline Tracking: Teamcamp's milestone tracking features align perfectly with PERT's focus on key events and deadlines. Set up milestones that correspond to critical path events and receive automated notifications as deadlines approach.
Task Prioritization: Easily prioritize tasks on the critical path to ensure they receive the attention they need. Teamcamp's visual task boards can be configured to highlight critical path activities, ensuring the team always knows where to focus.
Seamless Collaboration: Bring developers, designers, and project managers together on a single platform, ensuring smooth communication and task alignment. Teamcamp's comment threads, file sharing, and @mentions keep everyone in sync without endless email chains or context switching.
Time Tracking: Developers can track time spent on tasks, helping optimize work efficiency and project planning. This data becomes invaluable for future PERT estimates, as it provides historical information about how long similar tasks actually took.
Custom Workflows: Adapt Teamcamp to your team's specific processes. Whether you're using Scrum, Kanban, or a hybrid approach alongside PERT, Teamcamp's flexible workflow options support your methodology.
Reporting and Analytics: Generate reports that compare actual progress against PERT estimates. These insights help teams refine their estimation process over time, leading to increasingly accurate projections.
Teams using Teamcamp report significant improvements in their development processes, including 28% faster project delivery and 32% reduction in administrative work. The platform's intuitive interface requires minimal training, allowing teams to focus on development rather than learning complex project management tools.
Common Challenges and How to Overcome Them

Implementing PERT in software projects isn't without challenges. Here are some common issues and how to address them:
-
Difficulty in Time Estimation: Software developers often struggle with accurate time estimation. Overcome this by:
- Involving multiple team members in the estimation process
- Breaking tasks down into smaller, more manageable chunks (ideally no more than 1-2 days of work)
- Refining estimates based on historical data from similar tasks
- Conducting regular estimation retrospectives to improve future estimates
-
Changing Requirements: Software projects frequently face changing requirements. Address this by:
- Regularly updating your PERT diagram and recalculating the critical path when requirements change
- Building flexibility into your network by identifying tasks that can run in parallel
- Using modular design approaches that minimize the impact of requirement changes
- Implementing change control processes that evaluate the impact on the critical path before approving changes
-
Team Resistance: Team members might resist adopting a new methodology. Overcome this by:
- Starting with a small project to demonstrate PERT's value before implementing it more broadly
- Focusing on the benefits for team members (fewer emergency crunches, more realistic deadlines)
- Providing training and support during the transition
- Using intuitive tools like Teamcamp that minimize the learning curve
-
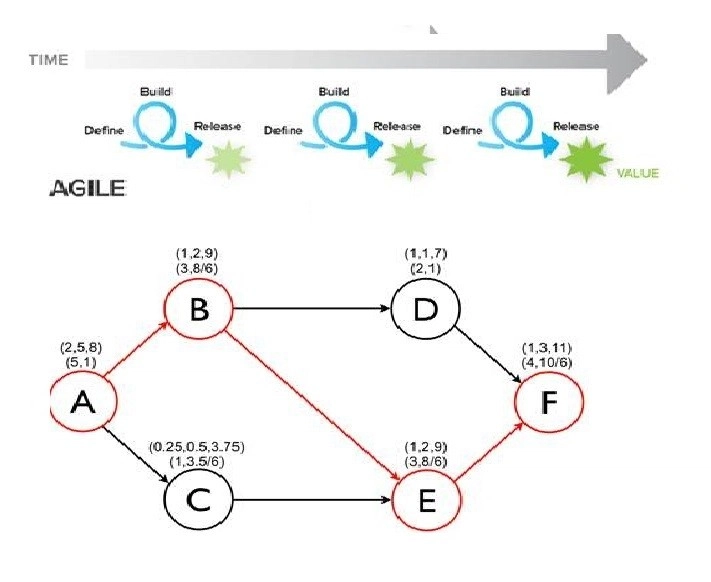
Integration with Agile Methodologies: Many software teams use Agile methodologies. PERT can complement Agile by:
- Using PERT for release planning while maintaining Agile practices for sprint execution
- Applying PERT to epics or features rather than individual user stories
- Updating the PERT network at the end of each sprint based on actual progress
- Using PERT's statistical approach to improve sprint planning and velocity predictions
-
Maintaining the PERT Network: Keeping the PERT diagram updated can become burdensome. Address this by:
- Automating as much as possible using project management tools
- Scheduling regular (but brief) PERT review sessions
- Focusing detailed PERT analysis on critical path activities
- Delegating responsibility for updating specific sections of the network to relevant team leads
PERT vs. Other Project Management Techniques
To fully appreciate PERT's value, it's worth comparing it to other project management techniques:
PERT vs. Gantt Charts

While both visualize project timelines, Gantt charts focus on scheduling tasks against calendar dates, while PERT emphasizes task relationships and dependencies. PERT's probabilistic approach to time estimation gives it an edge for uncertain projects, while Gantt charts excel at communicating timelines to stakeholders.
Many teams use both: PERT for planning and identifying the critical path, and Gantt charts for communicating schedules to stakeholders.
PERT vs. Critical Path Method (CPM)
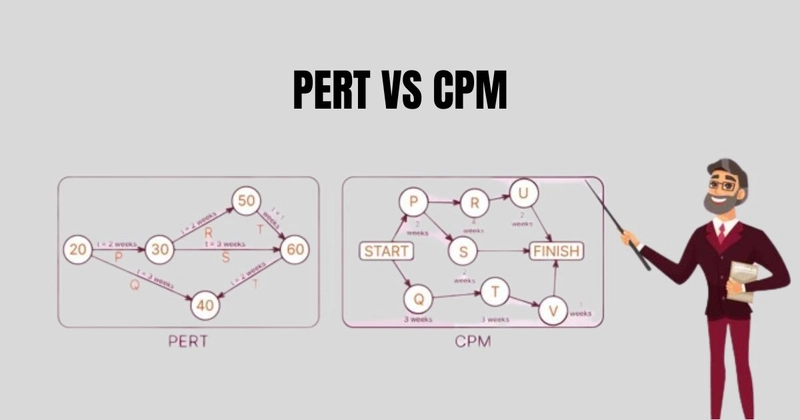
PERT and CPM are similar in their focus on identifying the critical path, but they differ in their approach to time estimation. CPM uses single-point time estimates, while PERT uses three-point probabilistic estimates. This makes PERT better suited for projects with significant uncertainty, like software development.
PERT vs. Agile Methods
Agile methodologies like Scrum focus on iterative development with fixed-length sprints, while PERT provides a comprehensive view of the entire project. Rather than seeing them as competing approaches, many teams combine them: using Agile practices for day-to-day development and PERT for longer-term planning and critical path management.
Conclusion: Embracing PERT for Better Software Project Management
In the unpredictable world of software development, PERT offers a structured approach to planning and estimation that accounts for uncertainty. By implementing PERT in your projects, you can:
- Create more realistic project timelines
- Identify and focus on critical path activities
- Allocate resources more effectively
- Improve communication and collaboration
- Proactively manage risks and uncertainties
The statistical foundation of PERT acknowledges what experienced developers already know: software projects rarely go exactly as planned. By embracing this uncertainty rather than ignoring it, PERT provides a more honest and effective approach to project management.
As you look to enhance your project management practices, consider how tools like Teamcamp can support your PERT implementation. With its unified project dashboard, milestone tracking, and collaboration features, Teamcamp provides the perfect platform for applying PERT principles to your software projects.
By combining the statistical rigor of PERT with the intuitive interface and collaboration features of Teamcamp, your development team can achieve greater predictability in project timelines, improved resource allocation, and ultimately, more successful software projects.
Ready to transform your approach to software project management? Start implementing PERT with Teamcamp today and experience the difference in your next development project. Your team will thank you for the more realistic timelines, clearer priorities, and reduced last-minute crunches that come with proper PERT implementation.